

This paper presents a way to incorporate the neoclassical assumptions of the permanent income hypothesis and rational expectations into a spreadsheet version of a textbook new Keynesian model. This approach allows students to compare these schools of thought through many different types of numerical exercise, and so may improve course continuity. If students are asked to set up the spreadsheets themselves, any black box aspects of the exercises will be minimised because setting up the spreadsheets involves the students in the mathematics of the model.
Because modern macroeconomics is by nature dynamic, the mathematics involved are often difficult for undergraduate students to grasp. Moreover, constructing numerical illustrations of important dynamic relationships is very difficult and time consuming when using pencil, paper and calculator. Spreadsheet software, however, makes it possible to construct relatively large and complex numerical examples, allowing students to learn about the models from a more hands-on approach.
Jones and Judge (1990) introduced the use of Lotus 1-2-3 spreadsheets in exploring simple dynamic economic models. In their paper, spreadsheets are developed to explore the time paths of macroeconomic and microeconomic difference models. Specifically, their paper generates time-series data for simple Keynesian multiplier and permanent income hypothesis models as well as for a microeconomic cobweb model. Unfortunately, it was not straightforward to use early versions of Lotus 1-2-3 to solve the model for the equilibrium; consequently, the purpose of the examples was to graph the time-series data generated by the systems. Several spreadsheet papers, however, use simultaneous equation solving techniques to explore simpler static models. For an early example, see Johansson (1985). Adams and Kroch (1989) provide examples of the Keynesian cross, IS-LM and Phillips curve models using Lotus 1-2-3. Judge (1990a) develops a multiplier-accelerator model using Lotus 1-2-3. A few more recent papers use the iteration feature of spreadsheets to solve simultaneous equations. The iteration feature is essentially a numerical solution technique used by the spreadsheet to resolve circular references.(note 1) For example, Cahill and Kosicki (2000) use the iteration function in Excel to explore some properties of the Solow growth model. Goddard, Romilly and Tavakoli (1995) use a spreadsheet to solve the Mundell-Flemming (IS-LM-BP) model. While they do not specify how the spreadsheet solves the model, it is assumed that they employ this iteration function. A good alternative method for solving simultaneous equations is using matrix algebra commands. Judge (1990b) develops an IS-LM model using Lotus 1-2-3 and solves it by using matrix algebra commands. A more recent example of this model and technique may be found in the spreadsheet chapter of Judge (2000).
This paper explores how aspects of neoclassical economic theory can be integrated into a dynamic new Keynesian (aggregate demand-price adjustment) macroeconomic model.(note 2) For clarity we define neoclassical models as models in which prices are perfectly flexible and expectations are rational, so markets are in equilibrium as long as all information is known. New Keynesian models may have sticky prices or non-rational expectations, so markets do not immediately return to the long-run equilibrium. The basic new Keynesian aggregate demand-price adjustment model used in this paper was developed as Supplement 3 to our Cahill and Kosicki (2000) paper. The supplement is available at http://www.holycross.edu/departments/economics/mcahill/sejpaper.html . The original Excel spreadsheets containing the model and material for the figures in the supplement may be downloaded from this site as well. The model is the basic new Keynesian aggregate demand-price adjustment framework presented in Hall and Taylor's (1997) Macroeconomics textbook. It differs from a standard aggregate supply-aggregate demand model in that the aggregate supply curve is assumed to be perfectly horizontal in the short run, but the short run is assumed to be only about three months (one-quarter of a year). In the medium run (after three months), prices adjust, so the economy eventually converges to the long run equilibrium. Essentially, this means that the flat aggregate supply curve continually shifts over time. By integrating neoclassical elements such as the permanent income hypothesis and rational expectations theory into the model, students may directly compare the results of these schools of thought. In a course that introduces both sets of assumptions, this method allows greater continuity of the learning experience. We believe this has pedagogical advantages over traditional approaches that present the models in separate contexts.
A full write-up of the model can be found on the supplementary web page to our 2000 paper. For reference, the fundamental spending equations defining real aggregate consumption (C), investment (I), government purchases (G), net exports (X), taxes (T) and equilibrium GDP (Y) are displayed below, along with the expressions for money supply (Ms), money demand (Md), money market equilibrium, price adjustment (inflation) (p) and the price level (P). The interest rate is denoted by R, the money growth rate by mgth, expected inflation by pe, and potential GDP by YP. All lower-case letters are parameters.
| (Consumption function) | C = a + b(Y - T) | (3.1) |
| (Investment function) | I = e - dR | (3.2) |
| (Government spending) | G = G | (3.3) |
| (Net exports function) | X = g - mY - nR | (3.4) |
| (Tax function) | T = Tf + tY | (3.5) |
| (Spending balance, IS curve) | Y = C + I + G + X | (3.6) |
| (Real money demand) | Md/P = kY - hR | (3.7) |
| (Real money supply) | Ms/P = M/P | (3.8) |
| (Money growth) | Mt = Mt-1(1 + mgth) | (3.8a) |
| (Money market equilibrium condition, LM curve) | R = (k/h)Y - (1/h)(M/P) | (3.9) |
| (Inflation, price adjustment) | pt = pte + f(Yt-1 - Yt-1P)/ Yt-1P | (3.10) |
| (Adaptive inflation expectations) | pte = spt-1 | (3.10a) |
| (Price level) | Pt = (1 + pt)Pt-1 | (3.11) |
The equations are entered into a spreadsheet, as shown in Figure 1. The Excel file for Figure 1 (and all subsequent figures) is available at http://sterling.holycross.edu/departments/economics/mcahill/ckfigs.xls .
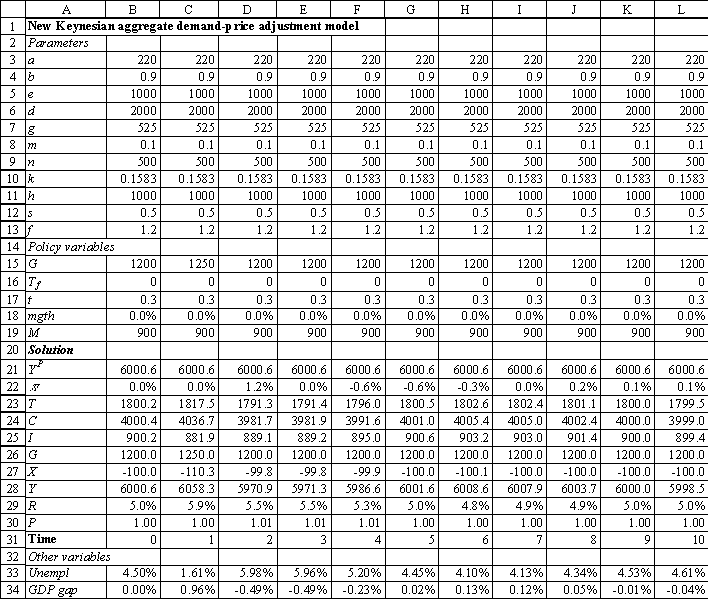
Figure 1. New Keynesian aggregate demand-price adjustment model
(Click to see full size image)
In addition to the equations above, Figure 1 contains rows corresponding to the percentage GDP gap [(Y-YP)/YP] and the unemployment rate from Okun's Law [0.045 + (1/0.03) (Y-YP)/YP].
A useful application of the spreadsheet model is to examine how the economy returns to the long-run equilibrium after a shock in the absence of stabilisation policy. For example, Figure 1 shows the effect of a one-time increase in government purchases of 50 in quarter 1 (see row 15) on an economy that is initially (in quarter 0) at its long-run equilibrium. It should be noted that whereas only 10 quarters are shown in Figure 1 above, it is often necessary for several more time periods to be added to display an economy clearly converging back to the long-run equilibrium after a shock. When the model is tracked for several quarters, graphs can be constructed to display the dynamic price adjustment process, and can be built from the sheets using Excel's Chart Wizard (use Insert/Chart to start the Chart Wizard). Figures 2 and 3 display 25 quarters of data corresponding to the one-time shock to government spending in Figure 1. Figure 2 depicts the Phillips curve data, and Figure 3 is the percentage GDP gap and inflation rate over time. Of course, charts of other time series could also be instructive: for example, interest rates, tax revenues, investment, etc.
The Phillips curve exhibits the familiar clockwise (cobweb) swirl towards the natural rate of unemployment, assumed here to be 4.5%. This pattern matches actual US (and most other country) data (see Hall and Taylor (1997) for historical examples). In the GDP gap-inflation graph, inflation reacts to the positive GDP gap with a lag. However, the rising inflation then drives GDP down towards and then past potential (this overshooting leads to stagflation). The economy recovers from the negative GDP gap with falling prices (negative inflation), and after overshooting again, settles back on its long-run equilibrium of zero inflation and a zero GDP gap. In this example, the long-run inflation rate of zero stems from the assumption of no money supply growth. In most economies, the central bank increases the money supply each year, with the result of a positive long-run inflation rate, and a negative inflation rate only in rare circumstances.
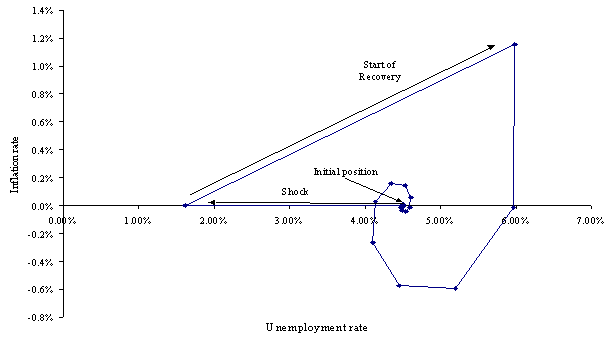
Figure 2: Inflation and unemployment response to a spending shock
(Click to see full size image)
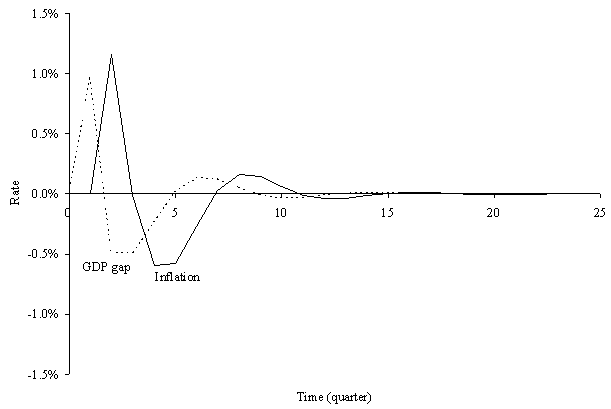
Figure 3: Inflation and GDP gap reactions to a spending shock
(Click to see full size image)
We will use Figures 2 and 3 as a reference to compare the behavior of the economy in the permanent income hypothesis framework below.
The permanent income hypothesis postulates that consumption is a function of permanent income rather than current income. While permanent income is defined as the sum of the net value of assets and future expected income divided into the expected years of a consumer's lifetime, one way to integrate permanent income into the new Keynesian model is to realise that permanent income should be approximately equal to potential GDP less taxes paid when GDP is at potential.(note 3) Thus, we modify the new Keynesian model to study the permanent income hypothesis by changing the consumption equation (3.1) to
| (Permanent income hypothesis consumption function) | C = a + b(YP - TP). | (3.1´) |
where YP is potential (long-run) GDP, and TP are the taxes that would be collected if income were equal to potential (Tf + tYP). This formulation is used instead of a more standard C = YP - TP to make the model more directly comparable to the new Keynesian model; the addition of the a in equation (3.1´) forces the long-run equilibrium values for the permanent income hypothesis model to be the same as the new Keynesian model. While this approach does not capture every characteristic of permanent income hypothesis models, it exhibits some key elements, as will be noted below.
With this assumption in place, the behaviour of the model is quite different from the traditional new Keynesian model. To illustrate this point, consider Figures 4 and 5. Figures 4 and 5 are identical to Figures 2 and 3 except that data for the permanent income hypothesis model have been added. The Figures show that the permanent income hypothesis model exhibits much less volatility than the benchmark new Keynesian model. This is because there is no spending multiplier effect; the government spending shock of 50 causes an increase in GDP of less than 50, as rising interest rates crowd out investment and net exports, and rising GDP also decreases net exports. This lack of a spending multiplier also means that the permanent income hypothesis economy initially returns more slowly to potential GDP, and does not overshoot potential GDP as much. In addition, the permanent income hypothesis model exhibits no change in consumption over the business cycle; this is more consistent with real-world data than the standard Keynesian model (see any intermediate-level macroeconomics text, such as Hall and Taylor (1997)).
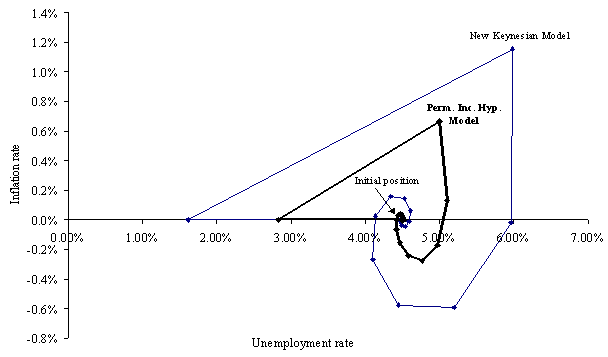
Figure 4: Inflation and unemployment response to a spending shock
(Click to see full size image)
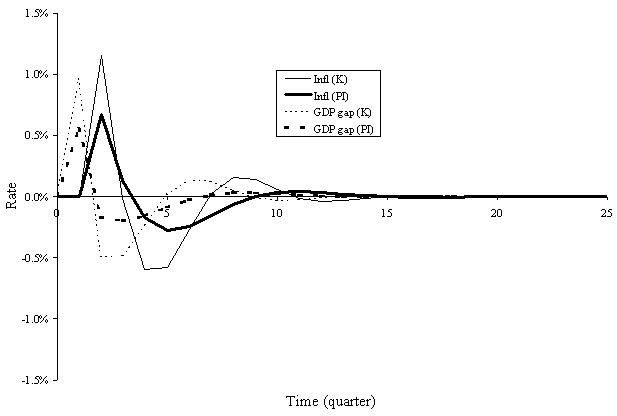
Figure 5: Inflation and GDP gap reactions to a spending shock
(Click to see full size image)
A monetary policy shock exhibits similar characteristics: the new Keynesian model has larger initial effects and a more volatile return to the long-run equilibrium than the model with consumption determined by permanent income.
An important aspect of neoclassical economics is that expected changes in the money supply change prices, but not real values in the short run (i.e., changes in the money supply are neutral). This result stems from the assumptions of rational expectations and flexible prices. An economy that has flexible prices and the ability to understand the impact of monetary policy will immediately adjust its price level to the optimal long-run level.
This feature may be incorporated into the spreadsheet model above by altering the price adjustment equation so that the expected inflation rate (pe) equals the growth rate of the money supply (mgth). Specifically, equation (3.10) is modified in the following way:
| (Inflation, price adjustment) | pt = (mgth) + f(Yt-1 - Yt-1P)/ Yt-1P . | (3.10´) |
Figures 6 and 7 compare the effects of a monetary shock in the original new Keynesian model and the version modified to reflect rational expectations (i.e., neoclassical). As Figures 6 and 7 illustrate, money is neutral in the neoclassical model but not in the original new Keynesian model. In fact, in the adaptive expectations version of the new Keynesian model presented in this paper, the economy permanently stays above potential GDP, and a long-run trade off exists between inflation and unemployment.(note 4) Figure 6 highlights this result and contrasts it with the vertical Phillips curve of the neoclassical variant of the model. Other charts might also be instructive: for example, adding a row to track expected inflation would allow a comparison between actual and expected inflation in the two models (they are identical in the rational expectations model).

Figure 6: Inflation and unemployment response to a money growth shock
(Click to see full size image)

Figure 7: Inflation and GDP gap reactions to a spending shock
(Click to see full size image)
The complex nature of macroeconomic models makes it difficult to present extensive numerical examples in class, or even include them as part of homework assignments. Spreadsheet software, however, largely eliminates the computational burden of such examples. This makes it possible for students to explore macroeconomic models with different assumptions, a classic case being the comparison of the new Keynesian and neoclassical models. Such a comparison is a complex undertaking, but the spreadsheets make the models more accessible and allow for more integration of the different schools of thought. At the same time, because a prerequisite for setting up the spreadsheet examples is a clear understanding of how the algebraic models fit together, having students set up the spreadsheets avoids the black box aspects of highly specialised courseware.
1 The iteration option in Excel is found under the Calculation tab that appears when Options is chosen from the Tools menu.
2 Microsoft Excel 97 was used to develop each of the spreadsheet models. Excel commands are given where appropriate. However, it is also possible to develop the examples in other programs, including recent versions of Corel Quattro Pro and Lotus 1-2-3.
3 Jones and Judge (1990) study the behaviour of a Keynesian cross-permanent income hypothesis model by approximating permanent income by a weighted average of recent years' income. Our approach is more consistent with long-run rational expectations.
4 This result is easily shown mathematically. Denote the percentage GDP gap as Ygap. Then, the price adjustment equation (3.10) is written p = sp-1 + fY-1gap. In the long-run steady state, p = p-1 and Y-1gap = Ygap. Thus, p = sp + fYgap, so Ygap = p(1-s)/f. Given that inflation equals the growth rate of the money supply in the long-run (p = mgth), Ygap = mgth(1-s)/f .
Adams, F. Gerard, and Eugene Kroch (1989), 'The computer in the teaching of macroeconomics', Journal of Economic Education, vol.20 (summer), pp.269-280.
Cahill, Miles and George Kosicki, (2000) 'Exploring economic models using excel' Southern Economic Journal, vol.66 (January), pp.770-792. See also http://sterling.holycross.edu/departments/economics/mcahill/sejpaper.html
Goddard, J.A., P.J. Romilly and M. Tavakoli (1995), 'Macroeconomics and information technology applications', CHEER, vol.9, no.1, pp.6-10.
Hall, Robert E. and John B. Taylor (1997), Macroeconomics, (5th edn), New York: W. W. Norton and Company.
Johansson, Jan-Henrik (1985) 'Simultaneous equations with Lotus 1-2-3: an example from macroeconomics', Byte (February), pp.399-405.
Jones, Robert, and Guy Judge (1990) 'Using spreadsheets in the teaching of dynamic macroeconomic models', British Review of Economic Issues, vol.12 (February), pp.93-112.
Judge, Guy (2000), Computing Skills for Economists, Chichester: John Wiley.
Judge, Guy (1990a), Quantitative Analysis for Economics and Business Using Lotus 1-2-3, Hemel Hempstead: Harvester Wheatsheaf.
Judge, Guy (1990b) 'Spreadsheets: flexible tools for data analysis, model analysis and problem-solving' in Richard Welford (ed), Information Technology for Social Scientists, Shipley, UK: European Research Press, pp.39-74.