

First an example to aid the understanding of probability distributions. Students should enter into a convenient cell the following expression:
@INT(@RAND*6)+1
This tells the program to choose a random number between zero and 1, multiply it by 6, make it an integer and then add one. By doing this we have simulated throwing a die. You can easily repeat the experiment 20 times, or even 8000 times, simply by copying the formula down the column. The program produces 20 or 8000 different numbers within seconds. This could be the beginning of a very interesting discussion about probability problems. For example, what happens if you throw 2000 times three dice at once? You can use the computer to simulate the process and to show how binomial distributions will approach the Normal distribution as you increase the sample size.
One of the most surprising things is how Quattro handles linear programming, a subject taught in every Business School. Consider the example outlined in the figure below:
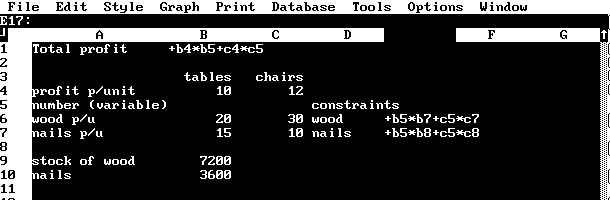 Figure 1 Spreadsheet - Tables and Chairs
Here we have two products (tables and chairs) being manufactured from two resources (wood and nails). The spreadsheet layout specifies the resources required for each product together with the amounts available and the formula for profits (which is to be maximised subject to the constraints). The only thing one has to do is to tell the computer (via the Advanced Math and Optimize menu selections) where the variables are (b5 and c5), what cell to maximise (b1), where the constraints are (e7 and e8) and what their level is (stated in b9 and b10). The constraint can even be a formula. One can add any number of constraints and even ordinary spreadsheets can handle thousands of variables and constraints. But the program is not just useful for the professional; the student has to "program" the problems himself but, once that is done he can easily change the parameters and gain a better understanding.
Let's take another random number application. Imagine a company selling a certain product and operating a maximum of 10 machines.
Each machine is handled by one person working 40 hours a week, but due to absence of workers or machine failure the maximum is not always available. On the other hand demand for machine hours is different evry week. Research shows that for 30% of the time demand is 250 hours and 8 machines (or 320 hours) are available. There is a 40% chance that demand is 400 hours and that capacity is 9 machines. The rest (30%) of the time demand is 500 hours and capacity is maximal, 10 machines or 400 hours.
So the company either has surplus capacity or has to work overtime, which is limited to 100 hours a week, or has to subcontract business. The problem is: should they buy another machine? In order to answer this question one can simulate a few hundred weeks. This is usually done with specialised simulation programs, but the same effect can be achieved with the aid of a simple spreadsheet. Make a special table, from cell A1 to C3
0.00 ; 250 ; 320
0.30 ; 400 ; 360
0.70 ; 500 ; 400
We then simulate demand and capacity, calculate overtime and
subcontracting beginning from cell A20. The formula is a
relatively simple one: @VLOOKUP(@RAND, A1..C3,1). This says;
take a random number as index, look in the first column
vertically and jump one column to the right.
@VLOOKUP(@RAND, $A$1..$C$3,1) screen shows demand is, say 500
@VLOOKUP(@RAND, $A$1..$C$3,2) capacity is, say, 320
@IF(B20.A20,B20-A20," ") blank space
@IF(A20-B20>100,100,@IF(A20-B20)>0,A20-B20," ")) overtime 100
@IF(A20-B20>100,A20-B20-100, " ") subcontracting 80
By copying this 500 times we can simulate 500 weeks. Overtime costs 25 per hour, subcontracting is 35. So by calculating the average costs of 500 weeks we can decide whether to buy a new machine. Or we could change the table, with capacity from 9 machines up to 11 and keeping the frequencies the same. We can repeat the experiment and look to see if costs are lower with the extra machine that costs 650 each week.
There are many other useful spreadsheet applications one can try.
Spreadsheets like Quattro can invert and multiply matrices, run regressions, solve equations etc. You can use the program to help you decide whether a linear or exponential fit is better for a monthly sales series and there are excellent built-in graphics as well. Using the spreadsheet environment to introduce mathematical and statistical methods you can make the material much more palatable than it seems with a traditional approach.
Victor Hermans
Voorschokn, The Netherlands