

[Note from web editor:] We regret that quite a few errors crept in between Jim Reiss' submission of his paper and its appearance in print and in the first
web version of this issue. The paper has now been corrected and appears below in its intended form.
A fundamental concept in finance theory is that of risk reduction through portfolio diversification. Two key theorems by which this concept can be quantified are the Markowitz two-asset portfolio model(2) and its extension, the capital asset pricing model (CAPM).(3) They contain many basic concepts including dispersion, correlation, risk reduction and efficient frontiers which students can find difficult. Learning the principles of these models from static text-books has limitations—there is nothing quite like building a model one’s self, particularly if suitable data sets are available with which to test the model over its parametric range.
Several years ago, faced with the problem of teaching accounting and finance classes the essence of the Markowitz model and the CAPM, I devised a computer project whereby the students were required to build the model in stages using the spreadsheet application, EXCEL.(4) Then, given different sets of stock-yield data for two negatively correlated stocks, each student was able to determine the optimum portfolio of two stocks, introduce the risk-free rate of return, and so extend the portfolio model to a basic CAPM model. By building their own models, I felt that the students were able to get a lot out of the project; gain a better understanding of the concept of risk reduction by portfolio formation; learn to model economic theorems; practice the use of EXCEL to reproduce a theoretical concept, and gain experience on the analysis of data sets.
Construction of the Markowitz model using a spreadsheet is relatively straightforward. However, to test the model, one requires representative data sets of at least two stocks which have reasonably predictable phase relationships, rates of return, growth and the volatility shown by real stocks in open markets. Preferably, one has data sets for stocks A, B and C in which stocks A and B are 180 degrees out-of-phase, and stock C is in-phase with either A or B. From a practical viewpoint, obtaining multiple sets of actual stock-price or stock-yield data suitable for a class of students, so that each student has a unique set of data on which to perform a full analysis, is all but impossible.
The crux of the problem for the instructor, then, is to be able to produce synthetic data sets for pairs or triplets of stocks which have desired properties and relationships, particularly growth, dispersion and correlation coefficients, and simultaneously, look like actual stock-price or stock-yield data with periodicity and Brownian motion. For example, synthetic price data for stocks A and B with growth rates of 0.5 and 0.4% per period; standard deviations of $6.29 and $2.23 respectively and a correlation coefficient of –0.55, are shown in Figure 1. Data such as these can be produced on demand with the EXCEL spreadsheet model described in this paper.(5)
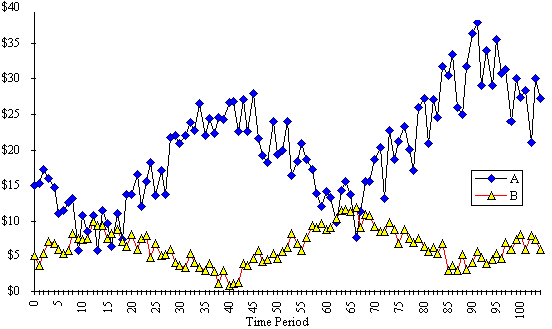
Figure 1: Simulated stock-price data for two negatively correlated stocks, A & B.
Using EXCEL, I constructed a linear symmetrical sawtooth function which I could use as a basis for generating cyclic price/yield data—the Phase-Sensitive Stock-Price Simulator (PSSPS). The model allows for control of the number of data points per cycle and/or the cycles per time-series; the growth rate; variability and most importantly, the correlation coefficient between two stocks, by setting the phase difference of two data sets in increments of 45 degrees.
In an alternative model, I constructed an underlying sin function(6) on which I could adjust the phase, add growth and randomness. This model, which is simpler to construct, also provides suitable synthetic stock-price data with desirable characteristics of growth, correlation, and dispersion. There is little to choose between them for instructional purposes—cosmetically, data sets from the alternative model look more sinusoidal, and from the sawtooth model, more angular. However, the latter probably better represents the discontinuous nature of actual stock-price data.
The logic of the PSSPS spreadsheet to generate synthetic stock-price or stock-yield data is described as follows. The example here is illustrated with a total data set (time series) of 105 sampling points (t0 to t104) which could represent either weekly or monthly data, as desired. This determines the number of rows in the spreadsheet. The six parameters which head the spreadsheet and are used to determine the characteristics of the data set are:
Setting the value of N allows for control over the number of data points per cycle, while the phase, f, sets the initial phase of the data point at t0. This becomes important for generating data sets for two stocks not in phase. The saw tooth multiplier controls the amplitude of the data cycle, and the randomness factor allows for control over the volatility of the data giving it a “real market profile”. For example, with s = 120% and r = 40-60%, and relative phase differences of, 180°, 135°, 90°, 45° and 0°, correlation coefficients, r, are produced typically in the approximate bands:
–0.65 to –0.45; –0.45 to –0.25; –0.05 to 0.15; 0.35 to 0.55, and 0.65 to 0.85.
The final share price, pn, for data point, tn, is determined by the addition of three components:
a) pgn, derived from the initial share price (p0) with geometric growth determined by tn and g;
b) psn, derived from a cyclic ± sawtooth component, its amplitude being determined by s, and
c) prn, derived from a random ± component, its amplitude being determined by r.
With growth rates, g, in the range 0.2–0.6% per period, s may be set in the range, 20–150%, and r, approximately 25–100% the value of s. These settings will generate satisfactory stock prices which have acceptable dispersions and profiles. As the value of g is increased, so should the value for s also be increased. For generating stock-yield data, g can be set to 0, as one would expect the mean yield for any given asset of a particular risk class to remain relatively constant.
The algorithms to generate the geometrically growing, sawtooth, randomised stock price are described in Equations 1–9, and illustrated by Figures 1–4. In the example illustrated, the key parameters are: n = 104; N = 52, and for stock-A,
f = 5; p0 = $15.00; g = 0.5%; s = 120%; r = 50%, and for stock-B,
f = 1; p0 = $5.00; g = 0.4%; s = 150%; r = 60%.
The process will be described for the stock-price model—similar logic can be applied to developing a stock-yield profile, however, in this latter case, g would be set to 0 as explained in the preceding paragraph. The spreadsheet has nine columns, each cell incorporating the functions of Equations 1–9:
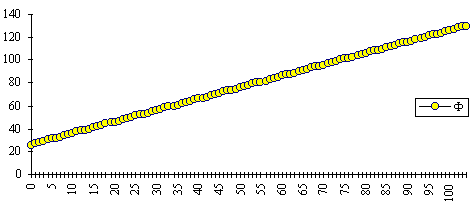
Figure 2: Linear phase offset (Fn)
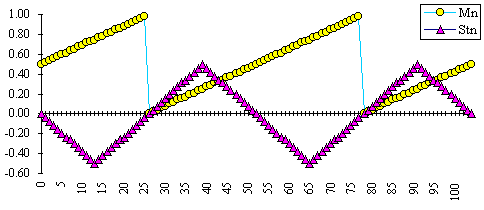
Figure 3: Modulus-normalised function (Mn) and sawtooth function (Stn).
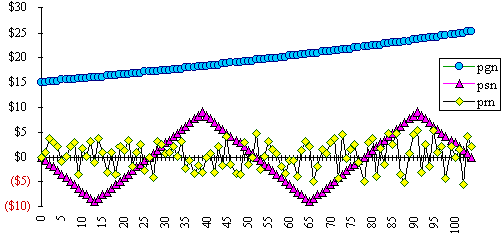
Figure 4: The three price factors, pgn, psn & prn
pn = pgn + psn + prn, Equation 9
The details of the PSSPS spreadsheet and the functions in each cell are shown in the Appendix.
Students were presented with data sets of synthetic stock-yields(8) (i.e., they would represent a combination of end-of-month prices and quarterly dividends) for each of two stocks, C and D, consisting of about 30–40 data points in each and having a correlation coefficient, –1 < r < 0 . For manual entry into a spreadsheet, 40 data points is sufficient, otherwise operator mistakes/boredom will ensue. Obviously, if the data is transmitted electronically from instructor to student, then larger data sets could be treated.
I prefer to have students work manually and closely with small size data sets. Deliberate error(s) can be introduced into the data with warnings to the class that the data should be scrutinised by plotting as a linear or scatter plot and then inspected visually (Figure 5). Alternatively, automatic screens can be incorporated into the spreadsheet to identify values lying beyond acceptable ranges. I prefer students to plot data and visually inspect it until they have developed a healthy respect for the GIGO philosophy.
It is relatively easy to construct a spreadsheet incorporating the Markowitz equation for the two-asset portfolio model (Equation 10),
![]() Equation 10
Equation 10
where the portfolio risk (standard deviation, sp) is a function of the standard deviations of each stock, sA and sB, their correlation coefficient, rAB, and the proportion, xA, and xB, of each stock in the portfolio.(9)
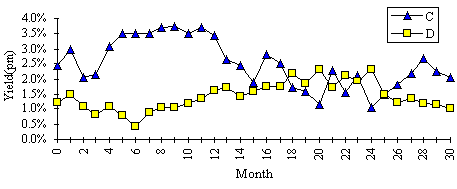
Figure 5: Stock yields (% pm) for C and D.
The average monthly (hence, annual) returns, standard deviations and correlation coefficient can be calculated for the stocks C and D by using the statistics functions within EXCEL. In this case, the annual mean returns for C and D are, 30.1 and 17.1% pa; sC, 9.6%, sD, 5.6%, and rCD, –0.63. By generating a matrix of portfolio risks for a range of portfolios from 100% C to 100% D at 10% intervals (or, at portfolio mixes which have differential returns at 1% intervals as in Figure 6) and for a range of rCD, from –1 to +1 say, at 0.2 intervals, a nest of curves can be plotted showing the returns for each portfolio at given levels of sCD and rCD (Figure 6).(10) From the empirically obtained value of rCD, an optimum mix of the two stocks can be determined which minimises the portfolio risk, in this case, approximately the curve at rCD = –0.6, or more precisely, a curve whose rCD = –0.63. This result can then be contrasted to that obtained for a portfolio of two correlated stocks, say D & E.
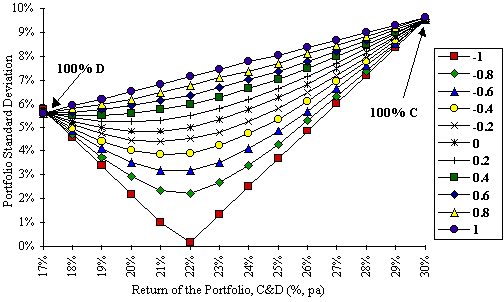
Figure 6: Plot of portfolio risk (C&D) as a function of return, at different correlation
coefficients.
In finance theory, the development of the concept and pricing of risk is extended, firstly, from the two-asset case to the n-asset case to create an opportunity set of investment possibilities.(11) By introducing further assumptions that a) all investors face the same opportunity set; b) there exists a risk-free asset to which investors may lend (or borrow), and c) market equilibrium, enables the creation of the capital market line (CML)(12) and full formulation of the capital-asset pricing model (CAPM).
In the instructional model in this paper, we simplify the n-asset opportunity set to the simplest two-asset case frontier. It is then a simple matter to incorporate the risk-free rate of return (asset F) and construct a tangential line to the two-asset frontier for C and D (visual inspection identifies the 22% point in the example shown in Fig. 7). This point sets the terminus of the straight line from the risk-free rate of return, 10%, to generate the capital market line and hence, an efficient frontier for a “three-asset CAPM”. It is now possible to determine optimum portfolios of the three assets, C, D and F given various sets of constraints.
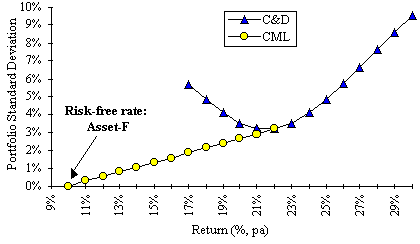
Figure 7: "Three-asset CAPM" for portfolio C, D & F.
The PSSPS spreadsheet described here can be used to generate multiple sets of synthetic stock-yield (or stock-price) data.(13) The unique data sets have correlation coefficients and dispersion which are controllable within predictable bands. The mean yields and standard deviations for each data set can be calculated, and the correlation coefficient (r) for pairs of data sets automatically determined. To obtain multiple sets of actual stock-yield/price data for a large class exercise, a) to test the two-asset portfolio theorem, and b) to build a simple CAPM model, can be very difficult. However, the spreadsheet described here will produce synthetic data sets on demand and allow each student to work independently on a unique set of data and so test both theorems.(14)
The appendix to this article is in a separate file.
(1) Department of Accounting & Management, School of Business, La Trobe University, Bundoora, Vic 3083, Australia. Email: j.reiss@latrobe.edu.au
(2) Brealey, R.A. and Myers, S.C., Principles of corporate finance, 5th ed, p 156, McGraw-Hill, New York, 1996.
(3) Ibid, p 183.
(4) EXCEL©, Microsoft Corporation, Redmond, WA.
(5) This algorithm can generate synthetic time-series data sets for any variable showing periodicity, growth and dispersion. It could be readily adopted to data for units of production, mass, volumes etc, and not merely restricted to prices or yields.
(6) For the sin function (Sn) Equation 4 takes the form:
Sn = SIN(Mn * 2 * PI())/2
(7) This returns a uniformly distributed variable. A normal distribution random variable generator would provide a better solution, but such a function is not immediately available within EXCEL.
(8) The data was produced with the PSSPS with g set to 0.
(9) This section is necessarily brief and is only meant to be an illustration of the use of the synthetic data. The author can provide spreadsheet examples for both the Markowitz and the CAPM models to interested readers.
(10) Traditionally, text-books show these nested curves plotted in terms of the dependent variable, “expected returns”, versus the independent variable, “risk of the portfolio”. For direct comparison, Figures 6 & 7 should be rotated anticlockwise by 90° and reflected. In EXCEL v 5.0, it is not possible to take directly, the output of the matrix of portfolio risks and create charts with orientations other than those shown in Figures 6 & 7.
(11) Bishop, S.R., Crapp, H.R., Faff, R.W. and Twite, G.R., Corporate Finance, 3rd ed, p 135, Holt, Rinehart and Winston, Sydney, 1993.
(12) Ibid, p 136
(13) By pasting multiple copies of the calculations across the spreadsheet and the use of the CalculateNow function, multiple sets of data can be quickly created.
(14) I thank Dr Bill Barger, Pasadena, California for helpful comments on and suggestions for this manuscript.
|
What's Related: · Other articles on the use of spreadsheets in teaching economics |