Volume 9, Issue 3, 1995

Examples for Economists with DERIVE™:
General Equilibrium for a
Cobb-Douglas Exchange Economy
Barry Murphy
University of Portsmouth
Introduction
In a Cobb-Douglas exchange economy with
m consumers and
n commodities,
each consumer maximises a utility function subject to a budget constraint,
specified in terms of the consumer's endowment vector. An equilibrium
price system has the property that the corresponding utility-maximising
demands are such that excess demand is zero. The advantage of the
Cobb-Douglas model in general equilibrium theory is that, like the
Leontief model of an economy with production, everything can be calculated
exactly. Indeed, the equilibrium price system is an eigenvector
corresponding to a unit eigenvalue of a square matrix of order n
associated with the matrix of endowments and of utility parameters. This
is explained briefly in Luenberger (1995). Related results and historical
precursors appear in Gale (1960). Computational aspects are discussed in
Eaves (1985). A complete account, with BASIC programs for implementing
solutions, is given by Afriat (1987).
This article shows how to calculate the general equilibrium of a
Cobb-Douglas exchange economy using DERIVE 3. The DERIVE file GE.MTH is
presented and discussed in the Appendix.
Essentially no knowledge of
DERIVE is required to use it. With this file one can
- calculate numerically the equilibrium prices, demands, incomes and
utilities for any Cobb-Douglas
- exchange economy
- produce a graphical representation of the equilibrium in an Edgeworth
box diagram, together with the associated contract curve and offer curves
in the case of two consumers and two commodities
- calculate symbolically the equilibrium prices, demands, incomes and
utilities for a Cobb-Douglas economy
In practice the number of commodities n should be no greater than
4 (see
the Appendix), though the number of consumers can
be arbitrarily large, depending on available computing resources.
Numerical calculation of Equilibrium
Start DERIVE and load the file GE.MTH using the command
Transfer Load
Utility GE.MTH. The file GE.MTH is loaded, but not displayed. Now
Author statements for the matrices of preference parameters and
endowments (see Figure 1 and
Appendix).
Author the expression SUMMARY(A,) and Simplify.
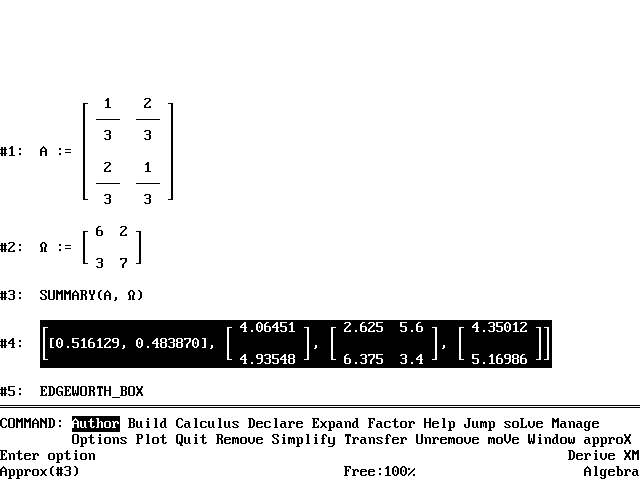 Figure 1
The equilibrium prices, incomes, demands and utilities appear after a few
seconds. Prices are normalised to add to unity. Calculation is speeded if
the preference parameters for each consumer are normalised to add to
unity, but this is not necessary. To obtain a graphical representation,
Author the expression EDGEWORTH_BOX, Simplify, and
Plot. In the 2D-Plot window issue the command Plot 0 [Tab]
1 [Ctrl-Enter] and a screen like Figure 2 appears.
To show that the file GE.MTH is not confined to the 2 by 2 case, generate
random preference and endowment matrices by Authoring the following
expressions:
RANDOM_DATA(m,n,s,t):=VECTOR(VECTOR(s+RANDOM(t),p_,n)q_,m)
RANDOM_DATA(5,4,0,1)
RANDOM_DATA(5,4,0,1)
Now Simplify the last two lines and
Author
A:=#n1
OMEGA:=n2
SUMMARY(A,OMEGA)
where #n1 and #n2 are the expression numbers generated by DERIVE. Simplify
the result to obtain equilibrium prices, incomes, demands and utilities
for a 5-person, 4-commodity Cobb-Douglas exchange economy with individual
endowments and preference parameters randomly distributed on the unit
interval [0,1].
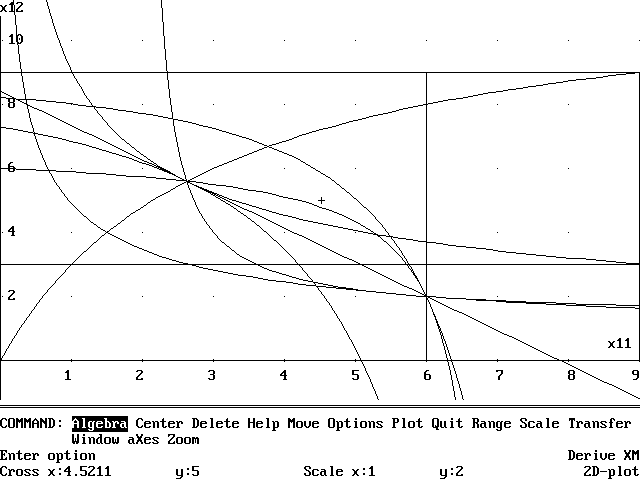 Figure 2
Symbolic Calculation
Figure 3 shows part of a calculation to obtain general symbolic results.
Author general expressions for the preference and endowment matrices, as
in expressions #23 and #24 of Figure 3. To speed calculation, normalise
these matrices so that the row sums of the preference matrix and the
column sums of the endowment matrix equal unity. Author the expression
EQ_P(A,) to obtain expressions for just the equilibrium prices. Author the
expression SUMMARY(A,) to obtain expressions for equilibrium incomes,
demands, and utilities as well.
Another symbolic calculation illustrates a property of the contract curve.
Author the expression
CC([[a11,a12],[a21,a22]],[[w11,w12],[w21,w22]],[[x11,x12],[x21,x22]]), and issue the commands Simplify, and Calculus Differentiate x11 [Enter] 2, to obtain the equation of the contract curve and to show that its curvature is determined solely by the determinant of the preference matrix.
Figure 3
Other Applications
The equilibrium price for good 1 in the example of Figure 1 is 16/31, with
the price of good 2 equal to 15/31 (Figure 1 gives decimal approximations,
though DERIVE calculates the prices exactly). The relative price of good 1
in terms of good 2 is therefore 16/15. One can use the file GE.MTH to
calculate and plot the dependence of this relative price on the
distribution of the total endowment between the two consumers. The
relative price is decreasing in both of the quantities held by the first
consumer, with values at the corners of the Edgeworth box equal to 2, 1,
1, and 1/2 (for these preference parameters). Author the expression
(EQ_P([[1/3,2/3],[2/3,1/3]]) SUB 1)/(EQ_P([[1/3,2/3],[2/3,1/3]]) SUB 2),
Simplify, and Plot to obtain Figure 4.
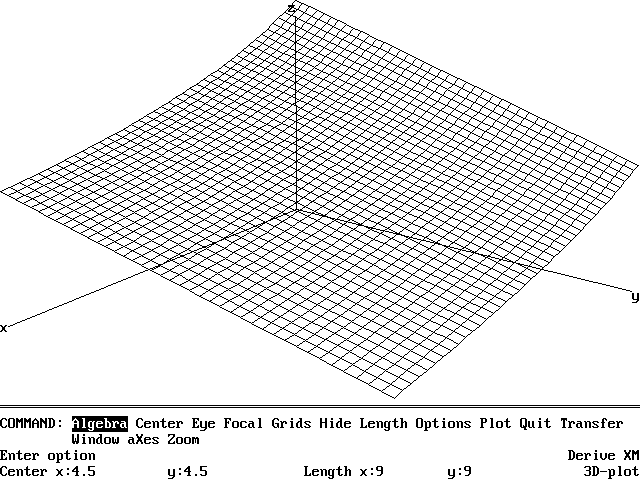
Figure 4
Conclusion
A variety of numerical, graphical, and symbolic results for Cobb-Douglas
exchange economies are presented using the medium of DERIVE. Noguchi
(1993), for a model including production, and allowing for C.E.S.
utilities obtains his results using Mathematica. The presentation here may
be rougher, but may have been briefer to create and may be simpler to use.
It must be emphasised that the results presented here do not generalise
beyond the class of Cobb-Douglas utility functions. This is to make a
virtue of the fact that for such models, everything can be calculated
exactly.
Barry Murphy
Department of Economics
University of Portsmouth
References
- Afriat, Sidney N., Logic of Choice and Economic Theory, Clarendon Press, 1987.
- Gale, David, The Theory of Linear Economic Models, McGraw-Hill, 1960.
- Eaves, B.C., "Finite Solution of Pure Trade Markets with Cobb-Douglas Utilities", Math. Prog. Study, 23, 226-239, 1985.
- Luenberger, David G., Microeconomic Theory, McGraw-Hill, 1995
- Noguchi, Asahi, "General Equilibrium Models", chapter 5 in Varian (1993).
- Varian, Hal R. (editor), Economic and Financial Modelling with Mathematicar, Springer-Verlag, 1993.
Appendix
bold):
"File GE.MTH, copyright (c) 1995 by Barry Murphy, University of Portsmouth"

"General equilibrium for a Cobb-Douglas exchange economy"

InputMode:=Word

CaseMode:=Sensitive

Branch:=Any

"Rows of A and omega correspond to consumers, columns to commodities"

"Cobb-Douglas parameters for consumer i in row i of A, all positive"

"Endowment vector for consumer i in row i of omega, all positive"

"A and omega must have the same dimensions, and no more than 4 columns"

R(a):=VECTOR(1/(SUM(a`)) SUB i_*a SUB i_,i_,DIMENSION(a))

"a must have non-zero row sums"

E(A,omega):=R(A)` . R(omega`)`

KRONECKER(i,j):=IF(i=j,1,0)

NORMALISED_EIGENVECTOR(a,mu):=SOLVE(APPEND([SUM([x1,x2,x3,x4]
SUB n_,n_,DIMENSION(a))-1],VECTOR(SUM((a SUB m_ SUB n_-
mu*KRONECKER(m_,n_))*[x1,x2,x3,x4] SUB
n_,n_,DIMENSION(a)),m_,DIMENSION(a))),VECTOR([x1,x2,x3,x4] SUB
n_,n_,DIMENSION(a)))

"Above 2 lines based on VECTOR.MTH, (c) 1990-1994 by Soft Warehouse, Inc."

"Eigenvector must have non-zero sum; the 0 vector indicates DERIVE failure"

EQ_P(A,omega):=RHS((NORMALISED_EIGENVECTOR(E(A,omega),1)) SUB 1)

EQ_I(A,omega):=EQ_P(A,omega) . omega`

D(a,r,p):=VECTOR(VECTOR((R(a)) SUB [s_,t_]*r SUB s_/p SUB
t_,t_,DIMENSION(R(a)`)),s_,DIMENSION(R(a)))

EQ_D(A,omega):=D(A,EQ_I(A,omega),EQ_P(A,omega))

U(A,X):=VECTOR(PRODUCT(X SUB [k_,l_]^A SUB
[k_,l_],l_,DIMENSION(A`)),k_,DIMENSION(A))

EQ_U(A,omega):=U(A,EQ_D(A,omega))

SUMMARY(A,omega):=[EQ_P(A,omega),[EQ_I(A,omega)]`,EQ_D(A,omega),
[EQ_U(A,omega)]`]

"The rest of this file deals with the case of 2 goods and 2 consumers"

"A and omega must be (2x2)"

A:=[[a11,a12],[a21,a22]]

omega:=[[w11,w12],[w21,w22]]

X:=[[x11,x12],[x21,x22]]

p:=[p1,p2]

MRS(A,X):=VECTOR(DIF((U(A,X)) SUB p_,X SUB [p_,1])/DIF((U(A,X))
SUB p_,X SUB [p_,2]),p_,2)

CC(A,omega,X):=RHS((SOLVE((MRS(A,X)) SUB 1=LIM((MRS(A,X)) SUB 2,X
SUB 2,SUM(omega)-X SUB 1),X SUB [1,2])) SUB 1)

ID(A,omega,p,X,h_,j_):=RHS((SOLVE((D(A,p . omega`,p)) SUB [h_,j_]=X
SUB [h_,j_],p SUB 1)) SUB 1)

OC(A,omega,p,X):=VECTOR(MAX(RHS((SOLVE(ID(A,omega,p,X,h_,1)
=ID(A,omega,p,X,h_,2),X SUB [h_,2])) SUB 1),0),h_,2)

"The rest of this file deals with plotting the Edgeworth box"

L(v,w):=(1-t)*v+t*w

B(v,w):=[L(v,[w SUB 1,v SUB 2]),L([w SUB 1,v SUB 2],w),L(w,[v SUB 1,w SUB 2]),
L([v SUB 1,w SUB 2],v)]

b:=[B([0,0],SUM(omega)),B([0,0],omega` SUB 1),B(omega` SUB 1,SUM(omega))]

u:=[U(A,omega),EQ_U(A,omega)]

I1:=VECTOR((u1/X SUB [1,1]^A SUB [1,1])^(1/A SUB [1,2]),u1,u` SUB 1)

I2:=VECTOR((SUM(omega)) SUB 2-(u2/((SUM(omega)) SUB 1-X SUB 2
SUB 1)^A SUB [2,1])^(1/A SUB [2,2]),u2,u` SUB 2)

c:=CC(A,omega)

l:=((EQ_I(A,omega)) SUB 1-(EQ_P(A,omega)) SUB 1*X SUB [1,1])/
(EQ_P(A,omega)) SUB 2

oc:=[(OC(A,omega,p,X)) SUB 1,(SUM(omega)) SUB 2-LIM((OC(A,omega,p,X))
SUB 2,X SUB [2,1],(SUM(omega)) SUB 1-X SUB [1,1])]

EDGEWORTH_BOX:=[b,[I1]`,[I2]`,c,l,[oc]`]
Note
This is one of a series of articles on DERIVE use in economics. Comments
and contributions are welcome. I will provide a copy of the file GE.MTH
to any interested reader.

