Replication and Reproduction I: Leybourne (1995) and the maximum Dickey-Fuller test
This case study is the first in a set of materials on the effective incorporation of research in undergraduate econometrics edited by Peter Dawson of the University of East Anglia.
1. Introduction
Cook and Watson (2025) have promoted the use of replication and reproduction (R&R) as a means of incorporating research into the teaching of econometrics. Emphasising the direct engagement with research necessitated by R&R, Cook and Watson (2025) argue it will lead to numerous benefits and allow a range of pedagogical objectives to be addressed.
In this case study, the work of Leybourne (1995) (Oxford Bulletin of Economics and Statistics) is employed as vehicle for utilising R&R in the teaching of econometrics. The focus of Leybourne (1995) is unit root analysis and, more specifically, the introduction of a higher-powered version of the Augmented Dickey-Fuller (ADF) test (Dickey and Fuller, 1979). To illustrate the empirical application of the proposed maximum ADF test, Leybourne (1995) employs the data used in the seminal research of Nelson and Plosser (1982). While this involves the analysis of fourteen different U.S. macroeconomic time series, the present case study demonstrates the application of R&R using one of these series. The discussion of the employment series presented here can, of course, be extended to the remaining 13 series in the Nelson-Plosser dataset.
The intention of the present case study is to use data employed in Leybourne (1995) to reproduce the results presented for both the ADF test and the (then new) maximum ADF test. In the process of undertaking this exercise, learners are prompted to engage closely with the work presented by Leybourne (1995) and to consider, inter alia: the decisions made with regard to the inclusion of deterministic terms in, and lag optimisation of, the relevant testing equations; the creation of a ‘reversed’ realisation of a series; the derivation of a maximum ADF test statistic; and the use of alternative, non-standard finite-sample distributions. Beyond these empirical issues, the revisiting of Leybourne (1995) also exposes learners to the issue of test power and its analysis via Monte Carlo simulation. Results demonstrating the relative powers of the two (ADF and maximum ADF) tests are provided in Tables 3 and 4 of Leybourne (1995), offering concrete examples that support classroom discussions of test power with specific simulated results.[1]
2. Reproducing the results of Leybourne (1995)
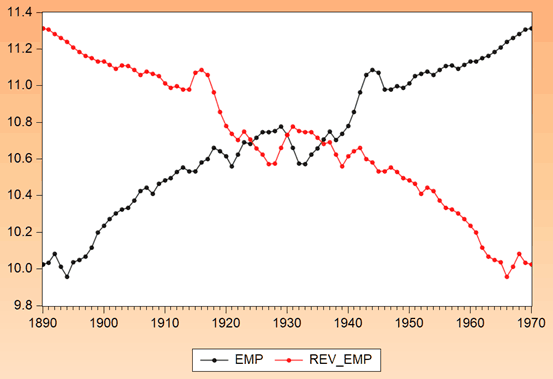
To illustrate the inclusion of the research in teaching, we consider one of the series examined in Leybourne (1995). The series considered is the employment variable contained in the original Nelson-Plosser dataset.[2] Here, the natural logarithm of the employment series is denoted as EMP and is observed at an annual frequency for the period 1890-1970.
The maximum ADF test of Leybourne (1995) is so named because it considers two ADF test statistics: the ADF test statistic resulting from examination of a series of interest (the usually considered ‘forward realisation’) and the ADF test statistic arising from examination of the ‘reversed realisation’ of the series. In short, for analysis of EMP we first examine the series running from 1890 to 1970 and then construct its reversed realisation (denoted as REV_EMP), in which observations run from 1970 to 1890. The resulting maximum ADF test statistic is then given as the greater value of the two ADF test statistics obtained. To illustrate the series, both EMP and REV_EMP are shown in Figure One below.
Figure One: Employment and its reversed realisation
The results reported in Leybourne (1995) from application of the ADF and maximum ADF tests to the two employment series are presented in Table One below.[3]
Table One: Leybourne (1995) results
| Leybourne (1995) | |||
| 1 | −3.13 | −2.97 | −2.97 |
The challenge for learners is to reproduce the results shown in Table One. The analysis for the two (forward and reverse) employment series is based upon the following underlying testing equation, labelled (1) below:
(1) 
The unit root null hypothesis can then be stated as ![]() and tested against the alternative hypothesis of (asymptotic) stationarity given as
and tested against the alternative hypothesis of (asymptotic) stationarity given as ![]() via the test statistic
via the test statistic ![]() . Table One presents the calculated
. Table One presents the calculated ![]() statistic, the ADF test statistic based upon the reversed realisation (
statistic, the ADF test statistic based upon the reversed realisation (![]() ) and maximum test statistic (
) and maximum test statistic (![]() = max[
= max[![]() ,
, ![]() ]).
]).
Two key issues of importance in applying the above unit root tests are the choice of appropriate deterministic terms in the underlying testing equation and determining its degree of augmentation (![]() ). Clearly, the series is trending so the deterministics to include are as given in (1) – that is,
). Clearly, the series is trending so the deterministics to include are as given in (1) – that is, ![]() . The value of
. The value of ![]() to employ is provided in Table One. However, flexibility is available to the lecturer to vary the challenge augmentation poses for reproduction. For example, to simplify the demands of the reproduction exercise, the value of
to employ is provided in Table One. However, flexibility is available to the lecturer to vary the challenge augmentation poses for reproduction. For example, to simplify the demands of the reproduction exercise, the value of ![]() could be provided to learners. Going a step further, the value of
could be provided to learners. Going a step further, the value of ![]() might not be disclosed and learners could instead be told of the decision rule employed by Leybourne. Alternatively, and more challenging still, students could be asked to consult the paper to find the rule employed. This would result in discovery of the use of the sequential
might not be disclosed and learners could instead be told of the decision rule employed by Leybourne. Alternatively, and more challenging still, students could be asked to consult the paper to find the rule employed. This would result in discovery of the use of the sequential ![]() -statistic rule and require utilisation of the appropriate level of significance for its application. Clearly this latter option reinforces the earlier discussion of R&R requiring learners to engage with the studies they read.
-statistic rule and require utilisation of the appropriate level of significance for its application. Clearly this latter option reinforces the earlier discussion of R&R requiring learners to engage with the studies they read.
Reproduction of the results of Leybourne (1995) is provided in Tables Two and Three below. Clearly when producing the results in Tables Two and Three a range of issues arise in addition to challenging knowledge of how to correctly specify appropriate testing equations. For example, the drawing of inferences requires appreciation of the fact that while the ADF test results for the original (forward) series will involve consideration of the Dickey-Fuller distribution, inferences for the maximum ADF test will require appropriate consideration of the tabulated values provided in the tables of Leybourne (1995). Applying linear interpolation to critical values of −2.87 and −2.84 for the maximum ADF test at the 10% level of significance for sample sizes of 50 and 100 respectively, the resulting 10% critical value of −2.85 for the sample of 79 observations employed in this analysis allows rejection against a maximum ADF test statistic of −2.97. This rejection at the 10% level can be compared to a marginal failure to reject at this level using the ADF test (for the forward series), where the relevant p-value is 10.7%.
Table Two: Reproducing Leybourne (1995)- the original EMP series
Null Hypothesis: EMP has a unit root Exogenous: Constant, Linear Trend Lag Length: 1 (Automatic - based on t-statistic, lagpval=0.05, maxlag=11) | ||||
| t-Statistic | Prob.* | |||
| Augmented Dickey-Fuller test statistic | −3.128528 | 0.1070 | ||
| Test critical values: | 1% level | −4.078420 | ||
| 5% level | −3.467703 | |||
| 10% level | −3.160627 | |||
Table Three: Reproducing Leybourne (1995)- the reversed realisation of EMP (REV_EMP)
Null Hypothesis: REV_EMP has a unit root Exogenous: Constant, Linear Trend Lag Length: 1 (Automatic - based on t-statistic, lagpval=0.05, maxlag=11) | |
| t-Statistic | |
| Augmented Dickey-Fuller test statistic | −2.967223 |
As additional points, note that when undertaking the exercises in relation to Tables One to Three, the issues raised in Perron (1989, 1997) concerning misclassification of orders of integration as a result of structural change should be discussed. Therefore, discussion of potential power gains should be qualified by recognising breaks in the Nelson-Plosser series. Also, while the above activities provide an exercise in direct replication, using the terminology of Cook and Watson (2023), since results are automatically produced using econometric software, step replication could be performed via a more manual approach – creating lagged differenced terms, specifying and estimating the testing equation to be employed, and then identifying the relevant output to draw inferences.
3. Conclusion
Cook and Watson (2025) have championed the use of R&R as a means of introducing research into the teaching of econometrics, discussing a collection of potential benefits, including those relating to engagement, activity and pedagogical research. In this case study, the R&R has been illustrated using the study of Leybourne (1995). The above discussion has shown that the process of reproducing published empirical results develops both core econometric skills and transferable skills.
References
Cook, S. and Watson, D. 2023. The use of online materials to support the development of quantitative skills. In Nind, M. (ed.), The Handbook of Teaching and Learning Social Research Methods, Cheltenham: Edward Elgar. pp. 274-286.
Cook, S. and Watson, D. 2025. From provision to understanding: The effective incorporation of research in undergraduate econometrics. In The Handbook for Economics Lecturers. Economics Network. https://doi.org/10.53593/m4412a
Dickey, D. and Fuller, W. 1979. Distribution of the estimators for autoregressive time series with a unit root. Journal of the American Statistical Association 74, 427-431. https://doi.org/10.1080/01621459.1979.10482531
Leybourne, S. 1995. Testing for unit roots using forward and reverse Dickey-Fuller regressions. Oxford Bulletin of Economics and Statistics 57, 559-571. https://doi.org/10.1111/j.1468-0084.1995.tb00040.x
Nelson, C. and Plosser, C. 1982. Trends and random walks in macroeconomic time series. Journal of Monetary Economics 10, 139-162. https://doi.org/10.1016/0304-3932(82)90012-5
Ng, S. and Perron, P. 1995. Unit root tests in ARMA models with data-dependent methods for the selection of the truncation lag. Journal of the American Statistical Association 90, 268-281. https://doi.org/10.1080/01621459.1995.10476510
Perron, P. 1989. The Great Crash, the oil price shock, and the unit root hypothesis. Econometrica 57, 1361-1401. https://doi.org/10.2307/1913712
Perron, P. 1997. Further evidence on breaking trend functions in macroeconomic variables. Journal of Econometrics 80, 355-385. https://doi.org/10.1016/S0304-4076(97)00049-3
Footnotes
[1] The Monte Carlo results provided in Leybourne (1995) can be also employed to support discussions concerning the derivation and nature of critical values and the analysis of empirical size. The results concerning these issues are provided in Tables 1-2 and Tables 5-8 respectively.
[2] This data set is available from a number of sources including http://korora.econ.yale.edu/phillips/.
[3] These results are provided in Leybourne (1995, Table 9, p.570). It can be noted that different approaches to determining the degree of augmentation of ADF testing equations are employed in Nelson and Plosser (1982) and Leybourne (1995). While the former adopts an approach based upon the use of autocorrelation and partial autocorrelation functions, the latter employs the sequential t-statistic rule. It can also be noted that the different lag lengths obtained under these methods result in different calculated ADF test statistics, with the lag length of 2 in Nelson and Plosser (1982) resulting in an ADF test statistic of −2.66 in contrast to the value of −3.13 in Table One above.
↑ Top