How to import a table from PDF into Excel
Many sources of data are PDF files. There are online services to convert data tables from PDF to spreadsheet; for example CleverPDF.com, Investitech.com, PDF2Excel, SmallPDF, or DocsZone.
If such services are not working for you, there is also a conversion process that involves moving the data first into Word and then into Excel. These are the steps.
We will use Table 10 from the European Economy Statistical Annex. This shows economic growth rates for all 27 EU countries plus the USA and Japan (see site 8 in our links to free economic data)
Step 1: Open the relevant PDF file and select and copy table
The first page of Table 10 from the Spring 2007 version of the European Economy Statistical Annex is shown below.
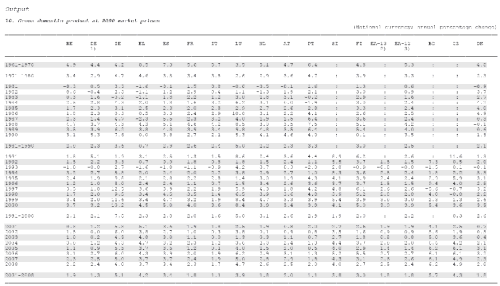
To copy the table, click on Select and click and drag the cursor to highlight the whole table. Then press Ctrl C (to copy this).
Step 2: Copy this into Word and convert to a table
Open a new Word document and paste the copied text by pressing Ctrl V. This should look as follows:
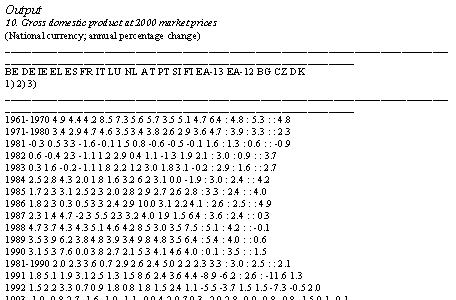
Now convert this into a table by highlighting it all (you can easily do this by pressing Ctrl A) and selecting Table > Convert > Text to Table. A dialogue box will pop up and under Separate Text at, you should select Other and click in the little box next to it; delete what is there and type in a space. Press OK.
A table will appear (poorly formatted) which will be all highlighted. While still highlighted, copy this by pressing Ctrl C.
Step 3: Paste this into Excel
Open a new blank Excel document. The first cell should be highlighted. Click in this cell and past in the table you have copied from Word. To do this, simply press Ctrl V. This will give you a table similar to that below.
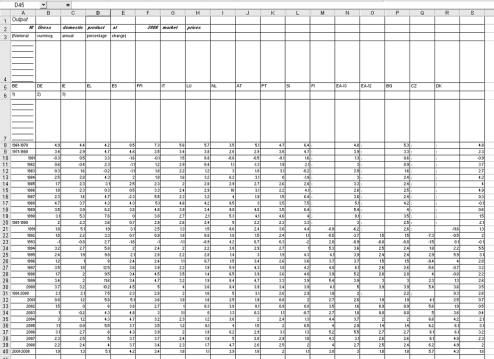
Step 4: Manipulating the Excel table
You will now need to do a little manipulation. It will help if you have an Insert Row and a Delete Row icon in your toolbar at the top (how to configure your toolbar).
First ensure that the columns are correctly aligned. In the above, row 5 is one cell too far to the left. To rectify this, click in cell A5 (currently labelled BE). Then click on Insert > Cells > Shift Cells Right and then OK. This will move all the entries in row 5 one column to the right.
Next delete unwanted rows, by selecting the row (click on the row number in the left-hand column) and then pressing the delete row icon (![]() ). In the above table you will probably want to delete rows 1, 2, 3, 4, 6 and 7. If you want to work out average inflation rates over the period 1961 to 2008, you will also want to delete all except rows 5, 8, 9, 20, 31 and 40.
). In the above table you will probably want to delete rows 1, 2, 3, 4, 6 and 7. If you want to work out average inflation rates over the period 1961 to 2008, you will also want to delete all except rows 5, 8, 9, 20, 31 and 40.
Step 5: Working out average inflation for the whole period
Insert a row below the final row of figures. Select the second cell of that row, click on the fx icon and in the right-hand panel select AVERAGE and press OK and OK again. This will give the average of that column. You can change the number of decimal places by clicking on the same cell again and selecting Format > Cells > Number and then choosing the number of decimal places.
When this is done, click on this cell again and copy it by pressing Ctrl C. Then simply use the right arrow key to go from one cell to the next, each time pressing Ctrl V. This will give the average for each respective column.
(Thanks to David Allen of the University of the West of England for suggesting this method.)
