Utilising the Quantity Theory of Credit to Understand the Causes of the 2007 Financial Crisis
© Copyright Maurice Starkey 2018 and available for reproduction under a Creative Commons CC-BY-SA license. Download this as a Microsoft Word document.
Introduction
This paper applies insights from Richard Werner’s publications to consider the causes of the financial crisis, and The Bank of England’s policy responses. It will begin by explaining some of the important elements associated with financial deregulation, and how these changes unleashed banks power to create new credit money. I will then use the Quantity Theory of Credit to explain the causes of the 2007 financial crisis. This will be followed by a consideration of the policies adopted by The Bank of England following the 2007 financial crisis, together with Richard Werner’s criticisms of those policies.
This paper will argue that the primary constraint on United Kingdom economic development is an imbalance between the funds allocated by financial markets for investments in activities that generate output of additional new goods and services in the economy that increase GDP, and allocation of capital for speculation in property and financial assets. Since the 1980s bank credit creation has expanded at a considerably faster rate than growth in GDP (please see figure 1), which indicates an increasing amount of bank credit money creation being channelled towards the purchase of existing financial and property assets that are not included within GDP, with the resulting misallocation of capital sowing the seeds of a future financial crisis. These imbalances cannot be rectified by continuing to allocate large quantities of new credit money to purchase existing assets for speculation. Instead, there needs to be a reallocation of new credit money to facilitate productive investment in businesses.
1. Financial Deregulation
Growth of Sterling M4 became increasingly disconnected from the gross domestic product (GDP) of the United Kingdom economy following banking deregulation introduced by Margaret Thatcher’s government, following the 1979 general election (please see figure 1). Bank deregulation was predicated on the belief that banks were mere financial intermediaries, and failed to recognise that banks are an important source of new money creation. Financial deregulation created a context that promoted a rising level of indebtedness that led to rising debt servicing costs, which placed increasing economic stress on the real economy’s ability to finance the resulting debt servicing costs.
Figure 1: Broad Money (M4) relative to GDP at market prices (1980 to 2018)[1]
Banks’ primary lending comprised of non-mortgage lending to companies, until financial deregulation occurred in the 1980s. Until the 1980s domestic mortgage financing in the United Kingdom was largely restricted to building societies, which were separately regulated. A Joint Advisory Committee placed quantitative restrictions on building societies mortgage lending, defining the total value of mortgage lending that should be completed each year (Ryan-Collins, Lloyd, & Macfarlane, 2017, p. 130).
Prior to the Competition and Credit Control (CCC) reforms being introduced in 1971, The Bank of England rationed bank credit through quantitative ceilings on bank advances, and provided qualitative guidance that influenced the type of lending conducted by banks. In 1971, the Competition and Credit Control reforms were introduced that enabled clearing banks to directly engage in wholesale money markets, whereas previously banks had only been able to trade in wholesale money markets via their finance house subsidiaries, or via discount houses. This regulatory change enabled banks to acquire money directly from the money markets, rather than being dependent on the central bank providing central bank reserves and cash. The competition and credit control reforms also replaced the eight per cent cash reserve ratio and 28% liquidity reserve ratio with a single 12 ½ per cent liquidity reserve ratio. The 1971 reforms changed The Bank of England’s role to managing interest rates, moving the central bank’s focus towards use of the price mechanism (rate of interest)[2].
Margaret Thatcher’s government removed foreign exchange controls in 1979 (Ryan-Collins, Greenham, Werner, & Jackson, 2011, p. 50), which opened the banking sector to increased foreign competition, and would later enable deregulated building societies to access overseas funding from international wholesale financial markets. Removal of exchange controls enabled organisations that were not authorised UK Banks to conduct foreign exchange transactions, leading to an explosion in international capital flows that caused the United Kingdom to become an important international centre for foreign exchange (including Eurodollar) transactions.
Further financial deregulation in 1980 led to the removal of the Bank of England ‘corset’ (supplementary special deposits scheme) that previously restricted banks’ ability to conduct domestic mortgage lending, and enabled banks to effectively compete with building societies mortgage provision for the first time (Ryan-Collins, Lloyd, & Macfarlane, 2017, p. 132; Bank of England, 1991). Abolition of the corset was a consequence of the removal of foreign exchange controls in 1979, which enabled banks to acquire funds offshore, and made the corset ineffective. The liquidity reserve ratio that banks were required to hold was gradually reduced from 12 ½ per cent in 1971, until eventually becoming effectively voluntary (Ryan-Collins, Greenham, Werner, & Jackson, 2011, p. 51). Quantitative restrictions on building society lending were also removed, as a consequence of the 1986 Building Societies Act that allowed building societies to borrow a proportion of their funds from wholesale money markets, and also enabled building societies to demutualise and convert to a bank (Ryan-Collins, Lloyd, & Macfarlane, 2017, p. 133). The reforms caused the breakdown of the building society interest rate cartel. The resulting increase in competitive intensity within the financial sector led to falling interest rates, and a declining interest rate spread (spread refers to the difference between the percentage cost of bank deposits and percentage return from loaned funds).
The Stock Exchange was deregulated on 27th October 1986, which is often referred to as the ‘Big Bang’. It enabled outside, and often foreign, ownership of firms that were members of the Stock Exchange. Deregulation enabled international banks to acquire stockbroking and jobbing firms in the City of London, and removed the requirements for stockbrokers and stockjobbers (stockjobbers create markets in shares) to be separated. It also removed the separation between investment banking and deposit-taking institutions that was still enforced in America through the Glass-Steagall Act, which caused American banks to increase their presence in the United Kingdom. Removing the separation between investment banking and deposit-taking institutions potentially enables investment banks to acquire new credit money from another part of the banking group that conducts deposit-taking activities, in order to fund trading positions in derivatives, commodities, property and financial assets.
The introduction of buy-to-let mortgages in 1996 enabled investors to purchase houses for rent, and caused private landlords to increase their share of the housing stock from 9.4% in 2000 to 19 per cent of the United Kingdom housing stock in 2014 (Council of Mortgage Lenders, 2016). Landlords generally receive a yield of between 3% and 5% per annum (Council of Mortgage Lenders, 2016).
Internationalisation of bank lending led to the development of an international regulatory framework. The Basle Committee on Bank Supervision was created in 1974 to harmonise international banking regulations, which led to the 1988 Basle Accord introducing minimum capital requirements, and risk weighting of assets. The risk weighting of loans to non-financial firms is double the risk weighting of secured mortgages on residential property, and a consequence of the Basle risk weightings is that banks can earn fees and net interest margins on double the amount of lending to real estate relative to lending to non-financial firms, with the same capital base. The first Basle accord produced significant global growth in both mortgage lending on residential property and bank leverage in the 1990s (Ryan-Collins, Lloyd, & Macfarlane, 2017, p. 135).
2. Credit money creation by banks and building societies
My previous paper (Starkey, 2018) explained how banks create credit money, and that the majority of money in the economy (sterling M4 liabilities to the private sector) comprises bank deposits (please see figure 2). The credit creation theory of banking proposes that individual banks can create money, and banks do not solely lend out deposits that have been provided to the bank. Instead, the bank creates bank deposits as a consequence of bank lending (McLeay, Radia, & Thomas, 2014; Werner R. A., 2013; Ryan-Collins, Greenham, Werner, & Jackson, 2011). Consequently, the amount of money that a bank can create is not constrained by their deposit taking activities. The repayment of existing debt destroys money, by reducing bank loans (asset side of balance sheet) and customer deposits (liability side of the bank balance sheet).
Figure 2: Bank deposits in relation to cash in circulation. The Composition of Sterling M4 Liabilities to the private sector, excluding intermediate other financial companies (OFCs)[3]
There was a significant increase in bank lending between 2000 and 2007, when the annual percentage increase in total lending by United Kingdom financial institutions exceeded 10% per annum (please see figure 3). Increased lending caused bank deposits to increase, creating new credit money that produced an annual increase in money supply of between 6% and 10% per annum between 2000 and 2007 (please see figure 4). Commercial banks introduction of new credit money into the economy is creating new purchasing power within the economy that did not previously exist, which significantly increases demand in sectors of the economy to which credit money is allocated.
Figure 3: Annual percentage change in total lending by United Kingdom financial institutions (1999 to 2017)[4]
Figure 4: Growth in bank deposits during the year as a percentage of money supply at the beginning of the year (1998 to 2017)[5]
3. The Quantity Theory of Credit
When increases in money supply as a consequence of new credit money creation by banks exceeds the growth of GDP (growth in gross domestic product) transactions in the economy, there are likely to be inflationary consequences. However, the consequences of credit money creation depend on the sector to which credit money is allocated.
The Quantity Theory of Credit presented by Richard Werner (Werner R. A., 1997; Werner R. A., 2013; Ryan-Collins, Greenham, Werner, & Jackson, 2011, pp. 109 - 110; Werner R. A., 2005, p. 226) proposes that the impact of bank lending for GDP transactions will depend on the purpose of lending. If lending is directed towards consumer credit that increases consumption, there is likely to be an increase in consumer price inflation as a consequence of increasing aggregate demand relative to the aggregate supply of products. Whilst bank lending for business investment to private non-financial corporations and unincorporated businesses encourages growth in economic activity. Investment that increases output of goods and services included in GDP transactions suppresses inflationary pressures in the economy, as a consequence of increased production of goods and services, and also raises the incomes of factors of production. However, only 15.5% of lending by financial institutions is being directed towards investment by non-financial firms and unincorporated businesses (please see figure 5).
Figure 5: Allocation of lending by financial institutions to sectors of the economy in June 2018[6]
Despite an increase in overall lending by financial institutions following the 2007 financial crisis, it is apparent that there was a substantial reduction in financial institutions lending to the sectors of the economy that increase value added from production of new goods and services, which increases gross domestic product and real incomes within the economy. Lending to both non-financial corporations and unincorporated business has fallen significantly following the 2007 financial crisis. Financial institutions lending to non-financial corporations has fallen 21% since 2008 (from £515 billion to £405 billion), whilst lending to unincorporated businesses has fallen by 41% since 2008 (from £48 billion to £28 billion) (please see figure 6). This could be an important contributory factor to weak labour productivity growth following the 2007 / 2008 financial crisis, because investment in physical capital stock per worker is an important factor in determining the growth of labour productivity (Barnett, Batten, Chu, Franklin, & Sebastiá-Barriel, 2014, p. 122).
Figure 6: Financial institutions lending to private non-financial corporations and unincorporated businesses following the 2007 - 2008 financial crisis[7]
There have also been criticisms of some banks' management of loans to small and medium sized enterprises. Nicky Morgan who chairs the House of Commons Treasury Select Committee recently stated in response to Promontory Financial Group’s report (Promontory Financial Group, 2018) on the management of small and medium sized business customers by Royal Bank of Scotland’s, Global Restructuring Group division:
“The findings in the report are disgraceful. The overarching priority at all levels of GRG was not the health and strength of customers, but the generation of income for RBS, through made-up fees, high interest rates, and the acquisition of equity and property”.
The Quantity Theory of Credit proposes that increasing the allocation of credit money for non-GDP transactions (transactions that do not increase GDP (gross domestic product)) will have no impact on economic growth, and will instead promote asset price inflation (Lyonnet & Werner, 2012, p. 95; Werner R. A., 2005). Credit growth for non-GDP transactions must be increasing, if total credit growth exceeds GDP growth (Werner R. A., 2013, p. 366). When lending for non-GDP transactions grows faster than the growth in GDP transactions it can produce asset price bubbles that create the potential for a future financial crisis. Non-GDP transactions are associated with the purchase of existing financial (for example, bonds, shares, and derivatives) and property assets that are sold in secondary markets. Secondary markets transact products previously sold within markets, such as previously issued financial assets (for example, company shares, bonds, and derivatives), and the transfer of ownership of property that has previously been purchased. Whilst primary markets trade newly created financial assets (for example, initial placing of shares by companies, rights issues of shares, and newly issued bonds) and the sale of new properties. The majority of financial and property assets are being resold, and so are traded within secondary markets.
Lending in the United Kingdom is primarily directed towards the purchase of existing property and financial assets (please see figure 7), which encouraged rapid growth in property and share prices, because increased purchasing power was directed towards the purchase of already existing assets that are relatively fixed in supply. During the period 1999 to 2007 the average United Kingdom house price increased by 140% from £93,000 in 1999 to £223,000 in 2007 (please see Figure 9). Figure 10 indicates that the growth in lending by financial institutions for purchasing property is an important determinant of house price growth, with a Pearson correlation coefficient between these two variables being 0.75[8]. Gross domestic product only includes transactions in newly created assets, and so an increase in money supply directed towards purchasing assets within secondary markets will cause a reduction in the money supply’s velocity of circulation (Werner R. , 2012; Lyonnet & Werner, 2012, p. 95).
Figure 7: Net lending by all financial institutions by lending category, and relative to GDP (£billion)[9]
Figure 8: Percentage change in house prices in relation to percentage change in lending to purchase dwellings.
Figure 9: Average United Kingdom house price 1970 to 2017[10]
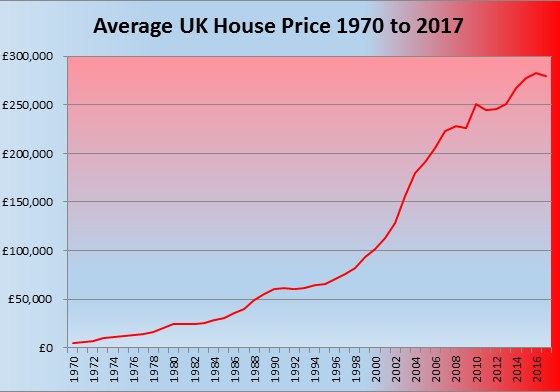
Figure 10: Impact of change in lending to purchase dwellings by financial institutions on house price inflation
Increased borrowing by speculators to purchase property and financial assets is encouraged by increased collateral arising from the initial speculative gains resulting from rising asset prices. A further factor increasing demand for assets whose value is rising, is speculators expectations that there will be future speculative gains arising from further increases in asset prices. Richard Werner (2005, p. 228; 2013, p. 362) refers to this as Say’s Law of Credit, because an increased supply of credit creates greater demand for credit to purchase property and financial assets, as a consequence of increased lending causing speculators to believe that there will be future increases in property and financial asset prices.
Banking crises tend to follow a period of rapid increases in asset prices (Reinhart & Rogoff, 2009). A substantial allocation of credit money creation for purchasing property and financial assets within secondary markets caused significant asset price inflation, which provided the context for the 2007 financial crisis (Werner R. A., 2013, p. 366). At some point the perception that assets may be over-valued influences investors’ perceptions of likely future price movements, and asset prices will fall when credit creation is no longer forthcoming for further asset purchases. This context produces a ‘Minsky Moment’ (Minsky, 1992). Falling asset prices cause speculators to lose money, and their loans will become non-performing because investors are unable to fulfil their contracted repayments. Banks have a relatively small capital cushion of around 10% of their asset base. Therefore, when the diminution in the value of a bank’s assets exceeds 10% it will cause the bank to become insolvent. Adair Turner (2017, p. 6) states:
“The vast majority of bank lending in advanced economies does not support new business investment but instead funds either increased consumption, or the purchase of already existing assets, in particular real estate. Real estate is relatively fixed in supply, and consequently the transfer of funds to this sector leads to asset price increases that induce yet more credit demand and more credit supply, which is at the core of financial instability in modern economies”.
The 2007 financial crisis was a consequence of commercial banks’ lending excessively for non-GDP transactions that encouraged speculators to purchase existing properties and financial assets with the intention of profiting from increasing asset values. Flows of new bank credit money promoted an increase in the prices of financial assets and property relative to the prices of goods and services in the real economy. Misalignment of prices in the financialised and real economies produced increasing debt servicing costs within the real economy, which placed increasing burdens on the real economy to service loans acquired to conduct non-GDP transactions. In the immediate aftermath of the 2007 financial crisis there was a need to resolve structural imbalances within the economy, which arose from rapidly increasing debt servicing costs that were a consequence of prices within the non-GDP sector of the economy rising much faster than the real-economic output of the economy could sustain.
Richard Werner suggests The Bank of England should have introduced regulations that would cause commercial banks to slowly reduce their lending and credit money creation to facilitate non-GDP transactions relating to property and financial asset purchases, in order to facilitate the rebalancing of financial flows between sectors of the economy. Richard Werner suggests that The Bank of England should introduce regulations in the form of credit guidance (also referred to as window guidance[11] (Werner R. A., 2005, pp. 268 - 270; Werner R. A., 2013, p. 368; Ryan-Collins, Greenham, Werner, & Jackson, 2011, p. 111)), in order to define the proportion of lending that should be allocated by commercial banks to various sectors of the economy. The current aim of credit guidance should be to promote increased lending to the real economy to promote an increase in GDP transactions, whilst reducing lending to speculative sectors of the economy. Commercial banks would incur financial penalties, if they did not adhere to changing the direction of lending to improve macroeconomic stability. The Bank of England has not introduced credit guidance for commercial banks, and imbalances within the economy have consequently increased. Lending for the purchase of property continued to increase relative to lending to private non-financial companies for investment that would increase GDP, post 2007 (please see figure 11). Secondly, lending by financial institutions to other financial institutions continued to rise relative to loans to private non-financial companies following the 2007 financial crisis (please see figure 11).
Figure 11: Lending to individuals and financial corporations relative to non-financial corporations[12]
Increased lending for property purchase caused a reduction in the affordability of property in England, which is reflected by the median English house price increasing from 3.5 times median annual earnings in 1997 to 7.7 times median annual earnings in 2016 (please see figure 12). The Bank of England could introduce a regulation that reintroduced the custom and practice pursued by financial institutions during the 1960’s and 1970’s that limited the amount that could be borrowed for property purchase to a maximum of three times the borrower’s annual income[13]. However, a decision to re-establish the three times earnings limit on borrowing for property purchase could cause a very substantial reduction in the average English house price, with any reduction in lending for property purchase likely to have a significant negative impact on the wealth of households that are significantly exposed to house price fluctuations. There is the prospect of a Minsky Moment (Minsky, 1992) occurring within the housing market that could severely constrain consumer expenditure, as a consequence of the wealth effect adversely impacting home owning consumers.
Figure 12: Ratio of median English house price to median annual earnings in England[14]
Richard Werner suggests that there is a structural aspect to the United Kingdom banking system’s focus on lending for speculative investment. Therefore, an important factor in preventing a future financial crisis would be to change the structure of the United Kingdom banking sector. Richard Werner suggests that the United Kingdom banking system is oligopolistic in nature (a few banks dominate the market), and operate at a national level. Senior management in United Kingdom banks are focussed on pursuing large investment projects, and there is a reduced emphasis on meeting the requirements of small to medium sized enterprises. Whereas, Richard Werner suggests Germany’s more regionally situated banking system facilitates greater familiarity of a bank’s management with the distinctive requirements of small and medium sized enterprises operating within their region, which is particularly important because small and medium sized enterprises generate the majority of jobs within an economy (Werner R. A., 2013, p. 382), and Mittelstand[15] are an important factor in post-war German economic development. Local and regional banks can reduce their exposure to credit default risk on business loans, due to their closer relationships with the business people borrowing money. This proposition aligns with Michael Porter’s theory relating to clusters that suggests service businesses, which includes banks, are important in giving a particular geographic area a competitive advantage in a particular industry, because the service sector in that area becomes focussed on meeting the unique requirements of important business sectors in the bank’s locality (Porter, 2000)[16].
The United Kingdom’s development of a large oligopolistic national banking structure may have contributed to the development of London as an important international banking centre. This would suggest the importance of developing requisite variety within the United Kingdom banking sector. However, requisite variety (Ashby, 1969) is undermined by institutional isomorphism (DiMaggio & Powell, 1983) that cause banks that do not have the same approach to the dominant banks within their national market, to pursue strategies with the intention of becoming increasingly aligned with the dominant banking model adopted by the leading banking groups within the United Kingdom. Therefore, the Clydesdale Yorkshire Banking Group that has a regional focus and diversified lending portfolio (which included significant business banking activity), chose to merge with Virgin Money that is more heavily oriented towards consumer finance and property lending, to develop a greater national presence, and become a challenger bank to the leading United Kingdom banking groups.
The failure of the government and central bank to resolve the significant imbalances in commercial bank lending between GDP transactions and non-GDP transactions will provide the basis for the next financial crisis. Lending for investment that increases GDP transactions is economically sustainable, because the value-added generated from producing new goods and services that increase GDP is used to finance repayment of interest and capital on borrowings, with the remainder of retained earnings being distributed between stakeholders to increase factor incomes within the economy. Whereas allocation of lending for non-GDP transactions creates asset bubbles. The next financial crisis is likely to be deeper than the 2007 financial crisis due to increased levels of debt, and increased imbalance in commercial banks’ lending between GDP and non-GDP sectors of the economy.
4. Central Bank Policies to Manage the 2007 Financial Crisis
4.1 Should the Bank of England reduce interest rates in response to this type of financial crisis?
The first policy decision by The Bank of England was to reduce interest rates, to reduce debt servicing costs and promote increased economic activity. The Monetary Policy Committee of The Bank of England reduced interest rates in steps from 5.5% in December 2007 to 0.5% in March 2009 (Lyonnet & Werner, 2012, p. 97). The Bank of England influences market interest rate by lending and borrowing central bank reserves. The primary objective of The Bank of England’s open market operations (OMO) is to supply a sufficient quantity of central bank reserves to financial markets, in order to ensure that the market rate of interest remains close to the central bank policy rate (Bank of England base rate) (Ryan-Collins, Greenham, Werner, & Jackson, 2011, pp. 48 - 50).
The transmission mechanisms of monetary policy identify the various channels by which interest rate changes influence economic activity (please see figure 13), and are discussed in a paper produced by the Bank of England (1999). A change in the official Bank of England interest rate influences market interest rates charged by other financial institutions, by altering the rate of interest that banks receive on the balances they hold at the Bank of England. A change in the official market interest rate causes savings rates to change, together with interest rates on various types of borrowing. The impact of changing interest rates impacts real economic activity through various channels. Lower market interest rates provide an economic incentive to reduce saving, which promotes increased consumer expenditure. Lower market interest rates reduce existing debt servicing costs, which increases personal disposable incomes and encourages greater consumption. Lower interest rates also encourage increased borrowing by both firms and households, because the future cost of repaying debt is reduced. New investment is promoted as lower interest rates enable firms to invest in projects that generate a lower return on investment than previously, but still achieve a percentage rate of return that exceeds their cost of capital. Rising demand within the economy causes businesses to operate at higher levels of capacity utilisation, and rising capacity utilisation within firms combined with lower interest rates encourage firms to increase investment.
Lower interest rates promote increased asset prices, because reduced market interest rates encourage investors to transfer their money to other asset classes that generate higher rates of return. If market interest rates are reduced from 5% to 1%, then property investors are likely to be willing to purchase properties that produce a net return on investment in excess of the 1% money market interest rate. A reduction in the market interest rate encourages investors to bid up the price of assets, until the rate of return earned on an asset is slightly above the money market (risk free) interest rate. Although, the volatility of returns associated with a particular asset class, and risk to capital, will be further factors influencing the premium that investors seek relative to the risk-free rate of return earned on money. Higher asset prices produce a wealth effect, because owners of assets perceive themselves to be wealthier as a consequence of rising asset prices. Greater perceived wealth is likely to encourage greater consumption by asset rich consumers.
Lower interest rates also influence expectations of households and firms about the future state of the economy, which will influence both consumption and investment behaviour within the economy. However, there is some uncertainty regarding how consumers and producers perceive the impact of interest rate changes on the economy. Lower interest rates may cause economic agents to perceive that economic activity will increase for the reasons discussed above, which will encourage increased consumption, production, and investment. However, economic agents may perceive that a reduction in interest rates is being introduced because the monetary authorities are concerned about the declining prospects of the economy, and the resulting pessimism could cause a reduction in consumption, production, and investment.
Figure 13: Transmission Mechanisms of Monetary Policy
Lower domestic interest rates reduce the rate of return earned on United Kingdom investments relative to rates of return earned in other currency areas, which encourages investors to move their capital to currency areas offering a better rate of return on capital. Expectations of currency depreciation will also encourage investors to move their money out of the currency, in the expectation that they can increase their capital by moving their money back into the currency following depreciation. Investors capital transfers to other currency areas are expected to cause a depreciation in the value of a currency relative to other currencies. Currency depreciation will benefit exporters whose product price can be reduced in export markets, increasing sales volume as a consequence of making their product proposition more price competitive within industries where price competitiveness is an important basis for international competitiveness. Alternatively, exporters can maintain their prices in export markets to increase profit margins. Imported products become more expensive when a currency depreciates, which encourages consumers to substitute domestically produced products that are more price competitive following currency depreciation for imports. Therefore, currency depreciation promotes increased demand for products produced within the currency area whose interest rates have fallen relatively faster than other currency areas.
An expansionary monetary policy promotes increased economic activity in the short-term. However, debt brings forward future consumption into the current period, which acts to constrain the growth of consumer expenditure in future years. This is a consequence of an expansionary monetary policy making the acquisition of loans more attractive, by reducing the future purchasing power that must be foregone as a consequence of acquiring a particular loan amount. However, in the medium to long-term the increased indebtedness resulting from an expansionary monetary policy will constrain future economic activity. Poorer households have the highest level of borrowing, and the largest marginal propensity to consume. Therefore, there will be a significant constraint on the growth of future consumer expenditure and economic activity as a consequence of high debt levels constraining future consumption by groups with the highest marginal propensity to consume (Mian & Sufi, 2011). Steve Keen stated that the only way for economies “to avoid a substantial decline in aggregate demand (and therefore a recession) from private sector behaviour alone is for private debt to continue rising faster than gross domestic product. But in a world in which debt necessitates interest payments, at some point aggregate debt servicing costs will exceed the income available to meet them” (Keen, 2017, p. 102).
Lee and Werner (2018; Lyonnet & Werner, 2012, p. 94) suggest that lower interest rates are not a lead indicator of increased future economic activity, due to the operation of the Monetary Transmission Mechanisms discussed in the Bank of England (1999) paper. Instead, Lee and Werner (2018; Lyonnet & Werner, 2012, p. 94) suggest interest rate changes follow changes in the economic growth rate, and interest rates do not promote changes in the economic growth rate. Consequently, an improvement in the economic growth rate causes interest rates to rise, whereas a contraction in the economic growth rate causes interest rates to fall (Lee & Werner, 2018, p. 28; Werner R. A., 2018; Lyonnet & Werner, 2012, p. 94).
Lee and Werner suggest that improving the United Kingdom’s economic growth rate requires The Bank of England to increase interest rates (Lee & Werner, 2018, p. 32; Werner R. A., 2018). Lee and Werner’s rationale for this counter-intuitive proposition is that The Bank of England currently relies on using the price mechanism (interest rates) to achieve market clearing within financial markets. However, the price mechanism only achieves balance between the quantities demanded and supplied within a market when a number of stringent conditions are satisfied. The conditions required for the price mechanism to efficiently clear markets include perfect and symmetrical information being held by both buyers and suppliers, perfect competition occurs within the market, there are no transaction costs, there are no time constraints, and price adjustments occur instantaneously within markets. The failure of financial markets to satisfy these stringent criteria means that the price mechanism does not provide an efficient means for matching supply and demand within financial market (Lee & Werner, 2018, p. 27).
Lee and Werner (2018, p. 27) suggest quantities become the primary driver of resource allocation when the price mechanism does not provide an efficient way of allocating resources within financial markets, due to the failure of financial markets to achieve at least some of the above criteria. When quantities become the main driver of resource allocation, market power and the ability to extract economic rents are available to the side of the market (buyers or suppliers) that is most limited (referred to as ‘the short side of the market’) Within financial markets the primary constraint is on lending, with a large number of borrowers competing for a limited availability of funds. Therefore, the supply of lending is the ‘short side’ within financial markets, and lenders engage in rationing the available funds based on their decision criteria.
Richard Werner suggests lower interest rates cause speculative investors to crowd-out businesses that seek to borrow funds for investment in productive assets to increase gross domestic product. Higher interest rates remove speculative investors from the market, providing a greater availability of funds for investment in productive assets that increase gross domestic product. Increased interest rates would lead to an increasing proportion of new credit money being allocated to sectors of the economy that use the funds to create new goods and services to increase gross domestic product and economic growth. Consequently, Richard Werner suggests that increasing interest rates will counter-intuitively produce an improved economic growth rate. Allocation of new credit money to productive investment creates a more sustainable financial system, because the value-added created by productive investment is used to repay loan capital and interest on accumulated debt, and generates profits to be shared between stakeholders of the value-added creating organisation.
4.2 What type of quantitative easing is appropriate?
Central banks must manage two important problems that financial institutions may encounter during a financial crisis. Firstly, banks’ must be able to maintain liquidity, which refers to banks being able to generate the cash required to meet their depositors demands to withdraw money from their bank accounts. Maintaining liquidity can be problematic for banks during a financial crisis, because banks engage in maturity transformation. Maturity transformation refers to banks generally acquiring money from customers for a short period of time, whilst providing loans to customers for much longer periods (for example, a bank may provide a 25-year mortgage). The difference in interest rates associated with borrowing for short periods of time whilst lending for a much longer period provides an interest rate spread that enables banks to make a profit. However, if a sufficiently large proportion of depositors seek to withdraw their money from the financial institution within a short period of time, the bank will have insufficient money balances and liquid assets to satisfy customers demands to withdraw their money[17].
Commercial banks must also remain solvent, which refers to commercial banks having sufficient assets to meet all their liabilities. Bank solvency is determined by whether a bank has sufficient capital to cover losses that reduce the asset side of a bank’s balance sheet. Banks have a relatively limited amount of capital relative to the credit money that they have created. When a bank’s bad debts exceed the bank’s 10% capital cushion it will cause a bank to become insolvent, because their assets are no longer sufficient to cover their liabilities (Werner R. , 2012, p. 21).
Figure 14: Important categories of assets and liabilities within a bank's balance sheet.
| Assets | Liabilities |
|---|---|
|
Please note: Bank capital is reduced by provisions that are made to cover depreciation of assets, and provisions for bad and doubtful debts of customers |
To protect the solvency of commercial banks, The Bank of England conducted a programme of quantitative easing, which involved purchasing assets primarily from non-bank financial intermediaries such as pension funds and insurance companies. Quantitative easing occurs when the central bank creates new money electronically, by issuing central bank reserves to purchase financial assets such as government and corporate bonds from financial institutions. Quantitative easing encourages non-bank financial institutions such as pension funds and insurance companies to diversify out of government backed securities into other types of financial assets and property, which helped to sustain property and financial asset prices, at least in the short-to medium term.
Maintaining asset prices prevented a reduction in house prices that would cause a contraction in consumer expenditure, as a consequence of the ‘wealth effect’. Maintaining asset prices avoids asset rich consumers perceiving themselves to be poorer as a consequence of falling asset prices, which would cause them to reduce their personal consumption. The Bank of England’s approach to quantitative easing avoided the significant fall in consumer expenditure that occurred in the United States, which is explained by Mian and Sufi’s levered - losses framework (Mian & Sufi, 2015, pp. 45-59).
The Bank of England’s quantitative easing programme is similar to the traditional open market operations policy conducted by the Bank of England to influence the flow of money and liquidity in the financial system. The Bank of England primarily purchased government treasury stock and some corporate bonds from non-bank financial intermediaries, such as pension funds and insurance companies, but also purchased some assets from commercial banks. The quantitative easing programme was largely spent purchasing government bonds (£435 billion), although a further £10 billion was spent purchasing corporate bonds. The £445 billion of quantitative easing (please see figure 14) is equivalent to approximately £6,780 per United Kingdom resident. Money supply increases from MS to MS2 as a consequence of quantitative easing, which reduces the interest rate from ir to ir2 (please see figure 15).
Figure 15: Impact of quantitative easing on interest rates[18]
Figure 16: Quantitative easing in £ billions since 2009[19]
The quantitative easing process involves the pension fund’s bank receiving additional central bank reserves from the Bank of England’s Asset Purchase Facility, which is used by the Bank of England to purchase gilt edged securities from financial markets. Consequently, pension funds holdings of treasury stock are reduced, and there is a corresponding increase in pension fund’s holdings of commercial bank deposits. The T-accounts for the pension fund and commercial bank resulting from the Bank of England’s Asset Purchase Facility purchasing a £100 of treasury stock are shown below:
| Assets | Liabilities |
|---|---|
|
Less: Sale of Treasury Stock leads to loss of asset on the balance sheet (£100)
|
Unchanged |
| Assets | Liabilities |
|---|---|
| Central Bank Reserves £100 | Deposit Pension fund £100 |
Quantitative easing may have a limited impact on commercial banks' liquidity, if non-bank financial institutions receiving the money rapidly use the money received from the sale of government treasury stock to acquire other types of financial assets and property. If the non-bank financial institutions maintain bank deposits with commercial banks the programme of quantitative easing will have a liquidity effect, because commercial banks will have significantly increased holdings of central bank reserves, which provides banks with the additional liquidity to increase their lending to the real economy and create new credit money for GDP transactions. Commercial banks high level of risk aversion in a recession caused by a high level of non-performing assets, means that this channel has been relatively weak in promoting greater economic activity. Secondly, the significant growth in financial asset and property prices meant new bank lending was directed towards the purchase of financial assets and property, because of the price momentum in these assets classes resulting from previous bank lending. Continued strong growth in financial and property asset prices provided speculators with the collateral for loans, and caused banks to perceive a low credit default risk associated with lending for speculative purposes.
Quantitative easing by The Bank of England increased the price of treasury stock as a consequence of the increased demand for government bonds created by the Bank of England’s Asset Purchase Facility. There is a portfolio rebalancing effect as The Bank of England’s asset purchase programme increases the price of treasury stock due to the reduced availability of treasury stock, which reduces the financial return (yield) received by investors in treasury stock. The financial return on treasury stock is fixed when treasury stock is first issued, as a percentage of the £100 value of each unit of treasury stock until the maturity date of the treasury stock. For example, Treasury Stock 1.5% 2020 generates a return of £1.50 per £100 unit of treasury stock between the date when the treasury stock is issued and the maturity date of the treasury stock. Reduced yields on treasury stock encourage financial institutions to acquire other types of financial asset (for example, corporate bonds, equities, and derivatives) and property that generate a higher yield. Increased demand by non-bank financial intermediaries for property, corporate bonds and equity helps to maintain asset prices, which will avoid bank loans that were used to acquire these types of asset from becoming non-performing in the banking sector.
The quantitative easing policy succeeded in maintaining both property and financial asset prices, and promoted further significant increases in asset prices after the 2007 financial crisis. £199 billion of quantitative easing conducted during 2009 and 2010 supported house prices, with the average house price increasing by 11.1% in 2010, despite there only being an increase of 0.7% in lending by financial institutions to individuals for property purchase. The average house price increased from £223,000 in 2007 to £283,000 in 2016 (please see figure 9), an increase of 27%. Whilst the Financial Times Stock Exchange (FTSE) 100 index has doubled since 1st February 2009, which provides a measure of share price increases following the quantitative easing programme.
The Bank of England’s policy of maintaining asset prices is intended to maintain the solvency of banks (bank assets are at least equal to, and ideally exceed, bank liabilities). Bank solvency enables the interbank market to continue to operate, because lenders within the market are no longer concerned about the risk of counter-party credit default, which maintains liquidity within the banking system. However, attempts by the monetary authorities to maintain asset prices above the historic mean, which aims to maintain the stability of the banking sector in the short-to-medium term, is likely to increase the risk of significant future asset price reductions that would sow the seeds of a future financial crisis that is more serious than the previous financial crisis.
Werner and Lyonnet (2012, p. 94) suggest the Bank of England’s quantitative easing programme that was announced in 2009 had no apparent effect on United Kingdom economic growth. Lyonnet and Werner suggest that to promote economic growth, The Bank of England should have directly targeted the growth of bank credit for business investment that facilitates growth in GDP transactions (2012, p. 94). The Bank of England could have provided loan guarantees for lending to non-financial corporations and unincorporated businesses, to indemnify risk averse banks for lending to sectors of the economy that raise GDP (Lyonnet & Werner, 2012, p. 96). The approach to quantitative easing adopted by the Bank of England was not the form of quantitative easing proposed by Richard Werner, because it did not promote increased credit creation by commercial banks as a consequence of the central bank agreeing to purchase all commercial banks impaired and non-performing loans at face value (Lyonnet & Werner, 2012, p. 96)[20]. The Bank of England was unwilling to engage in cleaning commercial banks’ balance sheet of non-performing loans, because of the potential moral hazard this created. Moral hazard suggests that if commercial banks are protected from the consequences of poor lending practices there is a risk that commercial banks will fail to learn from previous mistakes, which will increase future systemic risk in the financial system.
Despite £199 billion of quantitative easing conducted by the Bank of England during 2009 to 2010, total lending by financial institutions fell during the period 2010 to 2015 (please see figure 3), and the reduction in lending to non-financial corporations and unincorporated businesses was particularly significant (please see figure 6). Reduction in lending was so significant in 2011 that the money supply declined, due to a fall in bank deposits (please see figure 4). Commercial banks continued to emphasise lending for non-GDP transactions as a consequence of continued increases in financial asset and property prices, which suggests that commercial banks have failed to learn the lessons provided by the 2007 financial crisis.
Lyonnet and Werner (2012, p. 96) suggest the Bank of England could increase economic activity by lending directly to companies and the government. Lyonnet and Werner (2012, p. 96) also suggest that government should no longer issue bonds to fund government deficits. Instead, government should borrow directly from commercial banks, or The Bank of England, through standard loan contracts. Borrowing from commercial banks, or the central bank, creates new money that will not crowd-out existing private sector lending. Whereas, issuing bonds on the Stock Exchange will prevent the money government borrows from being loaned to the private sector, because the bond market primarily comprises of non-bank financial institutions that do not have the ability to create new credit money.
Bibliography
Ashby, W. (1969). Self-regulation and requisite variety. Systems thinking, 105 - 124.
Bank of England. (1999). The transmission mechanism of monetary policy. Retrieved from Bank of England: https://www.bankofengland.co.uk/-/media/boe/files/quarterly-bulletin/1999/the-transmission-mechanism-of-monetary-policy
Bank of England. (1991). The performance of major British banks, 1970 - 1990 (Quarterly Bulletin Q4). Retrieved from Bank of England: https://www.bankofengland.co.uk/-/media/boe/files/quarterly-bulletin/1991/the-performance-of-major-british-banks
Barnett, A., Batten, S., Chu, A., Franklin, J., & Sebastiá-Barriel, M. (2014). The UK Productivity Puzzle. Bank of England Quarterly Bulletin (Q2), 122.
Council of Mortgage Lenders. (2016). The profile of UK private landlords. Retrieved from Council of Mortgage Lenders: https://www.cml.org.uk/news/cml-research/the-profile-of-uk-private/
DiMaggio, P., & Powell, W. (1983). The Iron Cage Revisited: Collective Rationality and Institutional Isomorphism in Organizational Fields. American Sociological Review 48 (2), 147 - 160. JSTOR 2095101
Jarvis, J. (2011). The Crisis of Credit Visualized. Retrieved from YouTube: https://www.youtube.com/watch?v=bx_LWm6_6tA
Keen, S. (2017). Can we avoid another financial crisis? Cambridge, England: Polity Press.
Krugman, P. (2009, July 7th). The paradox of thrift — for real. Retrieved from The New York Times: https://krugman.blogs.nytimes.com/2009/07/07/the-paradox-of-thrift-for-real/
Lee, K.-S., & Werner, R. A. (2018). Reconsidering Monetary Policy: An Empirical Examination of the Relationship Between Interest Rates and Nominal GDP Growth in the US, UK, Germany and Japan. Ecological Economics, 146, 26 - 34.
Lyonnet, V., & Werner, R. A. (2012). Lessons from the Bank of England on 'quantitative easing' and other 'unconventional' monetary policies. International Review of Financial Analysis (25), 94-105.
McLeay, M., Radia, A., & Thomas, R. (2014 ). Money creation in the modern economy. The Bank of England Quarterly Bulletin (Q1), 14 - 27.
Mian, A., & Sufi, A. (2011). Consumers and the Economy, Part II: Household Debt and the Weak US Recovery. FRBSF Economic Letter, 2. Retrieved from Federal Reserve Bank of San Francisco: https://www.frbsf.org/economic-research/publications/economic-letter/2011/january/consumers-economy-household-debt-weak-us-recovery/
Mian, A., & Sufi, A. (2015). House of Debt: how they (and you) caused the Great Recession, and how we can prevent it from happening again. London: The University of Chicago Press.
Mian, A., Sufi, A., & Trebbi, F. (2014). Resolving Debt Overhang: Political Constraints in the Aftermath of Financial Crises. American Economic Journal: Macroeconomics, 6(2), 1 - 28.
Minsky, H. (1992). The Financial Instability Hypothesis. Working Paper number 74 (May). Retrieved from The Jerome Levy Economics Institute of Bard College: http://www.levyinstitute.org/pubs/wp74.pdf
North, D. C. (1990). Institutions, Institutional Change and Economic Performance. Cambridge: Cambridge University Press.
Porter, M. E. (2000). Location, Competition, and Economic Development: Local Clusters in a Global Economy. Economic Development Quarterly, Vol. 14 No. 1, February, 15 - 34.
Promontory Financial Group. (2018). Treasury Committee publishes RBS-GRG report. Retrieved from Parliament: https://www.parliament.uk/business/committees/committees-a-z/commons-select/treasury-committee/news-parliament-2017/rbs-global-restructuring-group-s166-report-17-19/
Reinhart, C., & Rogoff, K. (2009). The aftermath of financial crises. American Economic Review 99, no. 2, 466 - 472.
Ryan-Collins, J., Greenham, T., Werner, R. A., & Jackson, A. (2011). Where Does Money Come From? A Guide to the UK Monetary and Banking System. London: New Economics Foundation.
Ryan-Collins, J., Lloyd, T., & Macfarlane, L. (2017). Rethinking the Economics of Land and Housing. London: Zed Books Limited.
Starkey, M. (2018). Credit Creation Theory of Banking. Retrieved from The Economics Network: https://www.economicsnetwork.ac.uk/archive/starkey_banking
Turner, A. (2017). Between Debt and the Devil – Money, Credit and Fixing Global Finance. Woodstock: Princeton University Press.
Werner, R. (2012). Towards a new research programme on ‘banking and the economy’ - Implications of the quantity theory of credit for the prevention and resolution of banking and debt crises. International Review of Financial Analysis, 25, 1-17.
Werner, R. A. (1997). Towards a new monetary paradigm: A quantity theorem of disaggregated credit, with evidence from Japan. Kredit und Kapital, vol. 30, no. 2, 276-309.
Werner, R. A. (2005). New paradigm in macroeconomics: solving the riddle of Japanese macroeconomic performance. Basingstoke: Palgrave Macmillan.
Werner, R. A. (2013). Towards a More Stable and Sustainable Financial Architecture – A Discussion and Application of the Quantity Theory of Credit. Credit and Capital Markets, Vol.46, no.3, 357 - 387.
Werner, R. A. (2018). Shifting from Central Planning to a Decentralised Economy: Do we Need Central Banks? Retrieved from Professor Werner: https://professorwerner.org/category/articles-essays/
Footnotes
[1] The chart and related data are available within the M4 worksheet, which is contained in the charts and data workbook.
[2] Whilst the policy rate defines the rate at which banks and other financial institutions can access cash and Bank of England reserves, it does not constrain the rate at which financial institutions can lend to other organisations and individuals.
[3] The chart and related data are available within the ‘money supply’ worksheet, which is contained in the charts and data workbook.
[4] The chart and related data are available within the ‘all financial institutions’ worksheet, which is contained in the charts and data workbook.
[5] The chart and related data are available within the ‘all financial institutions’ worksheet, which is contained in the charts and data workbook.
[6] The chart and related data are available within the summary worksheet, which is contained in the charts and data workbook.
[7] The chart and related data are available within the ‘all financial institutions’ worksheet, which is contained in the charts and data workbook.
[8] Please see cell AA51 in the house prices worksheet, which is contained in the charts and data workbook.
[9] The chart and related data are available within the ‘all financial institutions’ worksheet, which is contained in the charts and data workbook.
[10] The chart and related data are available within the ‘house prices’ worksheet, which is contained in the charts and data workbook.
[11] Japanese monetary authorities operated a system of quantitative and qualitative credit controls during the post-war period, which Richard Werner refers to as 'window guidance' (Werner R. A., 2005, p. 269). Effective control and direction of credit by the monetary authorities supported rapid Japanese economic development during the 1950s, 1960s and 1970s. Credit controls should be developed with the aim of achieving specific economic growth targets. However, Japanese 'window guidance' from the mid-1980s allowed rapid credit expansion, and did not restrict lending for speculative purposes, which has since caused serious economic problems in Japan. Therefore, it is not sufficient simply to have credit controls in place. Credit controls implemented by the monetary authorities must aim to avoid excessive credit creation by the banking system, and limit the amount of credit being directed towards the purchase of speculative assets.
[12] The chart and related data are available within the ‘all financial institutions’ worksheet, which is contained in the charts and data workbook.
[13] The Bank of England have developed macroprudential policies since the 2007 financial crisis to avoid another financial crisis. The Financial Policy Committee has been created, which is able to impose loan to value, and loan to income, ratios on mortgages issued in the United Kingdom. In 2014, the Financial Policy Committee defined that no more than 15 per cent of new bank lending for residential home purchases should have a loan value exceeding 4.5 times the borrower’s annual income.
[14] The chart and related data are available within the ‘house prices’ worksheet, which is contained in the charts and data workbook.
[15] Mittelstand refers to a German small or medium sized enterprise that is family owned, and focusses on a particular niche sector of a product market.
[16] Therefore, banks within California have developed a specialism in accepting Californian wineries fermented wine as collateral for business loans.
[17] A shortage of liquidity created a problem for Northern Rock Bank, when a sufficiently large group of customers wanted to withdraw their money from the bank at the start of the 2007 financial crisis.
[18] I have used the liquidity preference theory of interest rate determination, which is also referred to as portfolio balance theory, to show that an increase in money supply will cause a reduction in the rate of interest. However, please note that a vertical money supply curve suggests that money supply is exogenously determined (government determines the amount of money in the economy), whereas this paper argues that money supply is determined by the actions of financial institutions operating within the market, which means that money supply is endogenously determined.
[19] The chart and related data are available within the ‘quantitative easing’ worksheet, which is contained in the charts and data workbook.
[20] The Bank of England did conduct this activity to a limited extent, through the Bank of England’s ‘Special Liquidity Scheme’, which was accessible to banks and building societies between April 2008 and 30th January 2009 (Lyonnet & Werner, 2012, p. 97), which allowed banks and building societies to swap some of their illiquid assets for liquid United Kingdom treasury bills.
