Trends in UK economics education (updated 2016)
An update of this report was published in February 2023
Introduction
This report is an update of the 2014 data the Network collected on students of economics in the UK. It forms part of the Economics Network’s ongoing research into economics education and provides a detailed summary of data collected student numbers in economics at both A-level and undergraduate level. This research aims to complement the Network’s report on the National Student Survey to highlight any issues that may be of note to departments.
Pre-university data
All data from the Joint Council for Qualifications website archive (http://www.jcq.org.uk/examination-results/a-levels)
Student numbers
- The number of students sitting A-level Mathematics has increased the most dramatically in the last ten years, compared with Economics and Business Studies, although this increase has slowed in recent years and even declined between 2015 and 2016.
- The number of students sitting A-level Economics has also increased in the last ten years, particularly from 2008 onwards, which may suggest some impact of the 2008 financial crisis. The long-term increases in Economics, however, are much less dramatic than those in mathematics.
- The number of students sitting A-level Business Studies has fallen over the past ten years but this has leveled off and even risen slightly in 2016.
- The proportion of female students studying Economics has remained relatively constant over the past ten years, despite increases in overall student numbers in Economics.
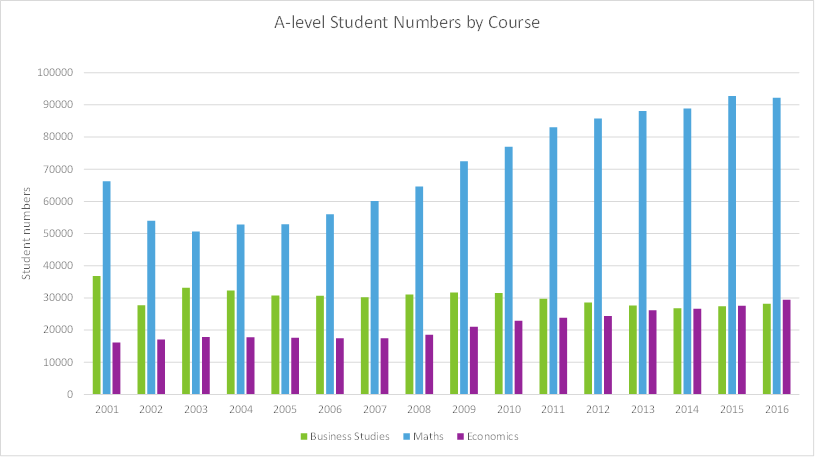
Figure 1, A-level student numbers by subject (2001-2016)
Percentage change in A-level student numbers
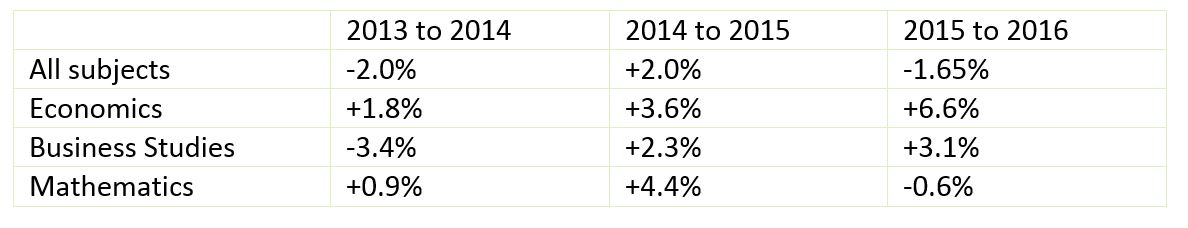
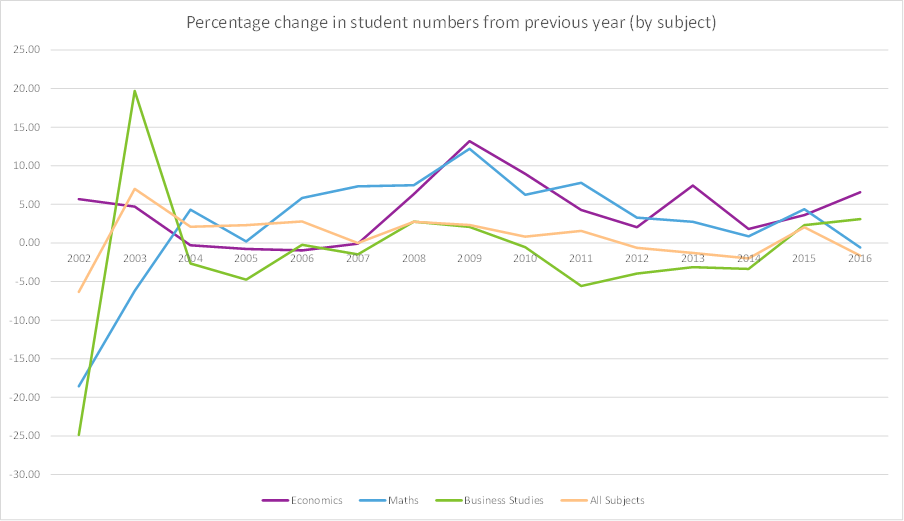 Figure 2, Percentage change in A-level student numbers from previous year by subject
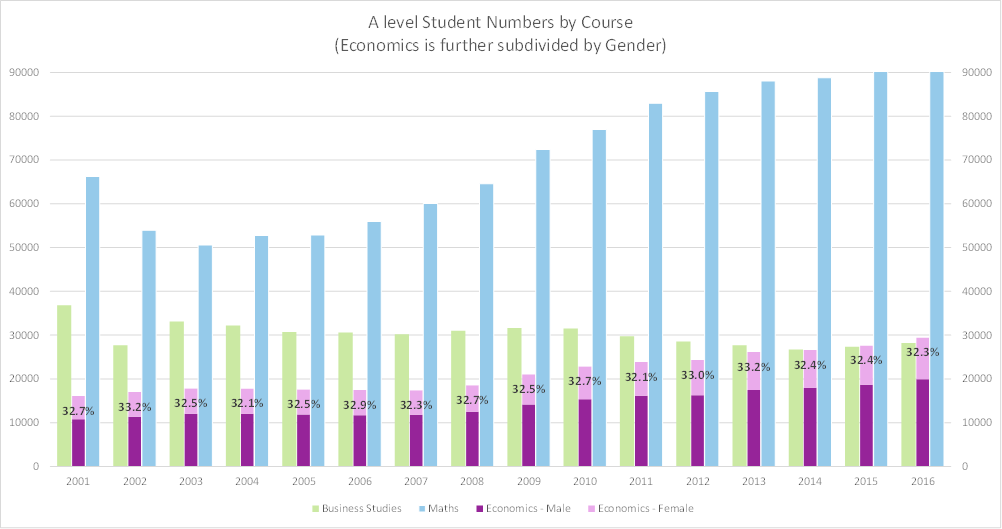 Figure 3, A-level student numbers by subject (economics is further broken down by gender)
Results
- A higher proportion of A-level students achieved an A* grade in Mathematics than in any other subject.
- Overall, the grades achieved by A-level economics students haven't changed significantly in the past three years, although the percentage of students achieving A* has fallen slightly, while the percentage of students receiving a B has increased.
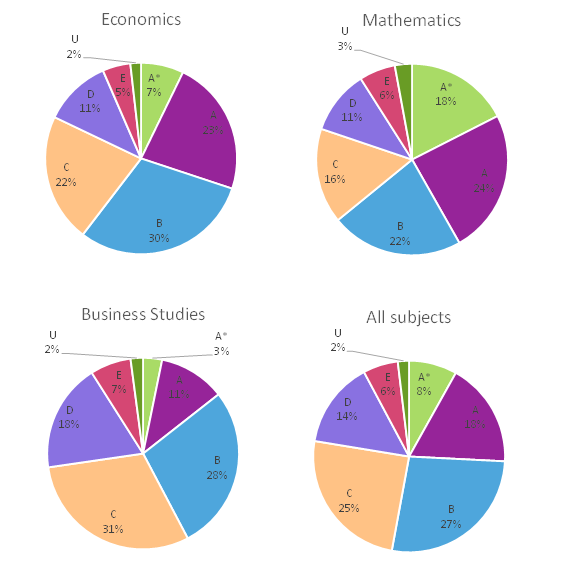
Figure 4, A-level results by subject (2016)
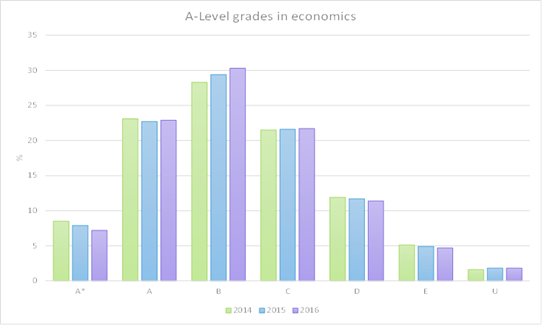
Figure 6, Changes in A-level results in economics (2014-2016)
University application data
All data from UCAS, https://www.ucas.com/corporate/data-and-analysis.
Based on a course search on the UCAS website, the number of institutions offering L100 undergraduate economics courses has gone up from 62 for the 2016 entry to 74 for 2017.
Entry requirements
The UCAS tariff points have been altered since our last report. Under the new system, the point allocations are as follows: A* = 56 points, A = 48, B = 40, C = 32 and D = 24.
- There is a fairly constant number of L100 Economics courses available across UCAS entry tariffs from 112 to 152 points.
- Russell Group universities tend to have the highest minimum entry requirements for L100 Economics courses with post-1992 universities having the lowest minimum entry requirements.
- 17 of the 74 universities found to offer L100 Economics courses for 2017 entry listed A-level Mathematics as a pre-requisite for their course, with nine of these requiring Grade A or better. One university required an A* grade in A-level Mathematics.
- None of the universities listed A-level Economics as a pre-requisite.
- 14 of the 74 universities offered sandwich/placement years as part of the course.
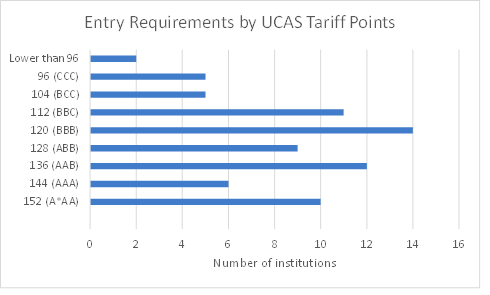
Figure 7, Entry requirements for L100 economics course, by tariff points and number of institutions
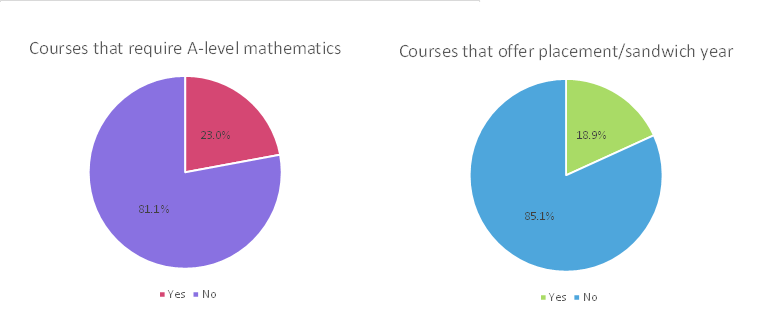 Figure 8, Percentage of courses that require A-level Maths and percentage of courses that offer placement year
Applications and acceptances
- Overall, all subjects included have seen an increase in applications and acceptances since 2007, although the rate of growth in applications has been significantly greater in finance than the other subjects.
- Most courses experienced a surge in application numbers before the introduction of the higher tuition fee cap in 2011 which was followed by a dip in application numbers for the first year of these higher fees (in most cases £9000) in 2012. This was most noticeable for Business Studies courses. Finance, however, was an exception to the rule as applications dipped in 2010 and returned to growth in 2011.
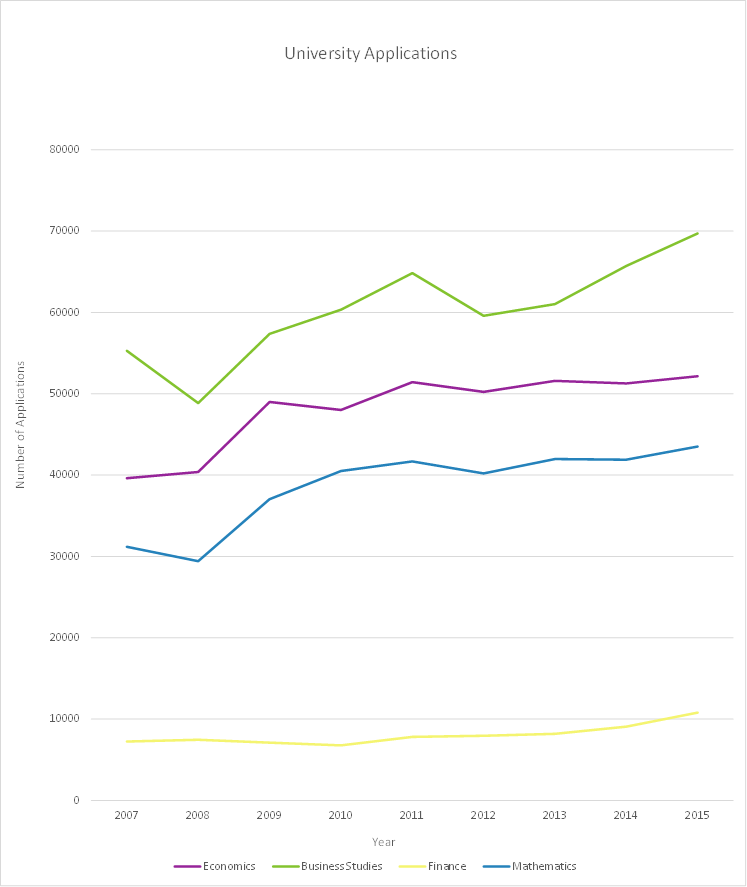
Figure 9, Number of applications by subject
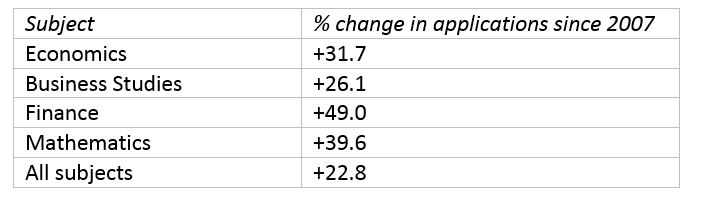
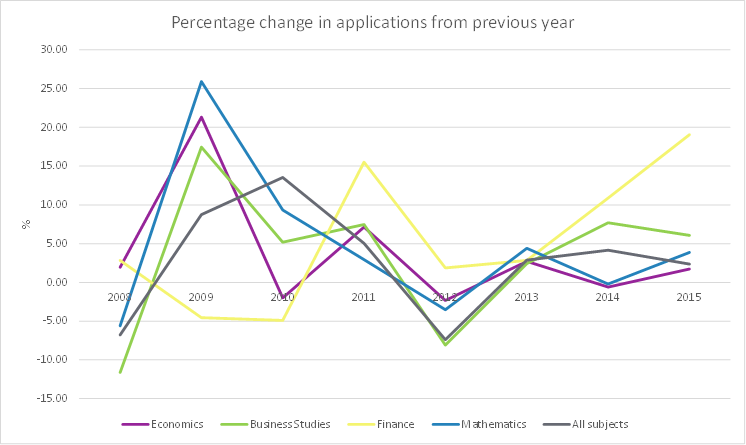 Figure 10, Percentage change from previous year in application numbers to undergraduate courses (by subject)
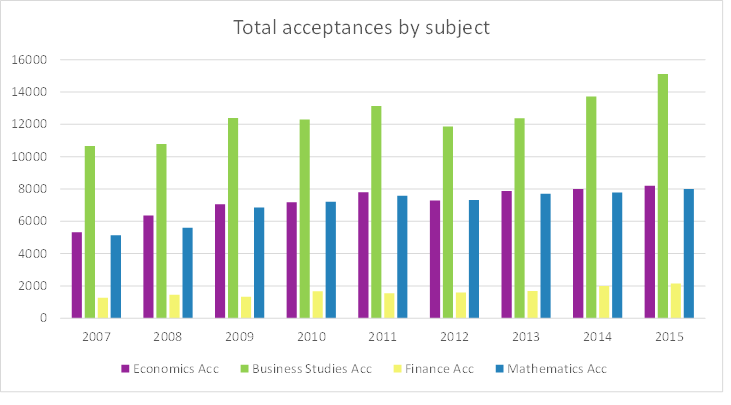 Figure 11, Total acceptances by subject
Demographics
Gender
- There is still a significant male bias in university-level Economics, with Business Studies and Mathematics also being male dominated, although less so.
- In comparison with the previous point, there is a majority female population in 2015 university acceptances overall (56% female).
- The A-level data shows that there is a similar proportion of female students between A-level and university-level Economics.
- While the total numbers of acceptances in economics have increased since 2007, the growth among female students has been much slower.
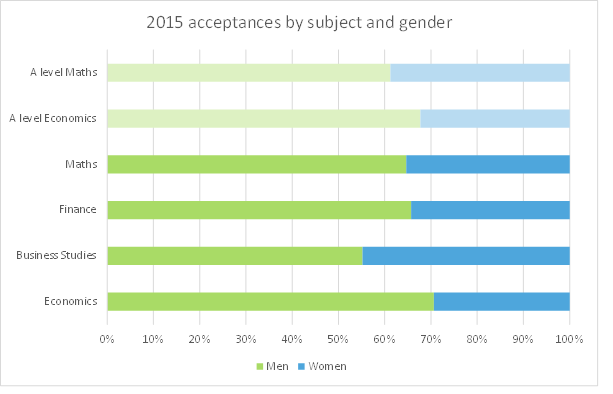 Figure 12, Acceptances by subject and gender (2015), the paler bars are for A-level subjects and are based on student numbers
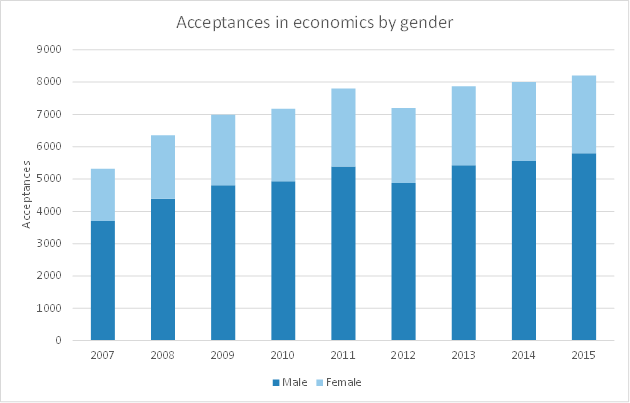 Figure 13, Acceptances to L100 economics courses by gender and year
--
View the original (2014) Trends in Economics Education Report
↑ Top