Microeconomic Simulator of Firm Behavior under Monopolistic Competition
Abstract
Computer simulators are proving to be indispensable education tools as they enable their users to readily apply theoretical knowledge and to automatically receive immediate feedback, which is invaluable both to learners and to their instructors. Yet at present, there is virtually no publicly available software for teaching economics to people who are new to this discipline. The Microeconomic Simulator of Firm Behavior under Monopolistic Competition is an interdisciplinary project which tries to fill this niche by providing an interactive means of strengthening and assessing a person’s grasp of fundamental economic concepts. It simulates the dynamic conditions of real-world markets that exhibit characteristics both of monopoly and of perfect competition, and demonstrates how choices made by a company’s executives affect its profitability. This is done in an intuitive manner through a user-friendly web application, which can be accessed from any device with an HTML5-compliant browser.
The application is based on a proprietary algorithm which transforms the abstract economic model of monopolistic competition into a series of easy-to-follow steps and supplies diagrams and pop-ups, which help users comprehend the consequences of their actions. The parameters of the model are fully customizable so that different economic environments can be explored. After the end of a simulation, users are presented with a summary of their performance, which they can use to measure their progress over time, or to see how they rank among their peers.
Keywords: monopolistic competition, profit maximization, computer simulators, microeconomic principles, teaching innovations
JEL Classification: A22, C63, C88, D21, L13
1. Introduction
The purpose of the microeconomic simulator is to provide an interactive method for reinforcing and evaluating a person’s understanding of basic economic principles. While computer software is permeating into every area of study, including the social sciences, the number of applications which are developed specifically for economics is surprisingly low. As a student majoring in the field, I have observed that this is even more the case when it comes to programs which are designed to facilitate the teaching of the discipline. Therefore, economics professors are left with no choice but to explain abstract concepts by nonreciprocal means such as academic textbooks, verbal presentations, and whiteboard illustrations. Such an approach leads to a limited understanding and a low retention rate.
Frequently, the sole practical technique of conveying the material is the manual solving of overly simplified problems. The main disadvantage of this method is that separately performing all necessary calculations by hand (or even with a calculator) is slow and error-prone, which is why it is not practised in the professional world. In order to accommodate for these inefficiencies, the difficulty and completeness of exercises inevitably have to be reduced, which again weakens the connection between the classroom and the real world. Moreover, individually grading every student by hand is also not an optimal use of an instructor’s time and effort.
After more than three years of double-majoring in computer science and economics, I have personally experienced this issue on a regular basis, which is why I have decided to try to remedy the current situation using the knowledge and skills I have acquired from my education. With this simulator, I am hoping to improve the process of teaching economics both for learners and for educators. The main target audience of the application are undergraduate students and their professors, particularly those taking or giving introductory economics courses such as the ECO 101 Principles of Microeconomics course at AUBG. In spite of this, the program has been designed with the aim that it should be readily usable by any person with little or no economics background, inside or outside of the classroom.
2. Design
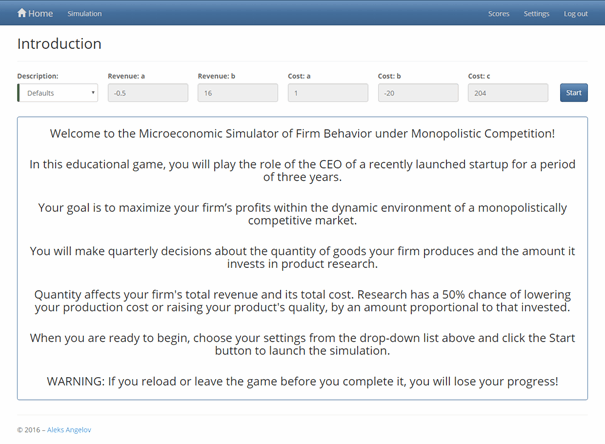
The simulator attempts to imitate a real-world scenario in the form of a turn-based educational game. After a brief introduction, players assume the role of the Chief Executive Officer of a recently launched startup company for a period of three years.
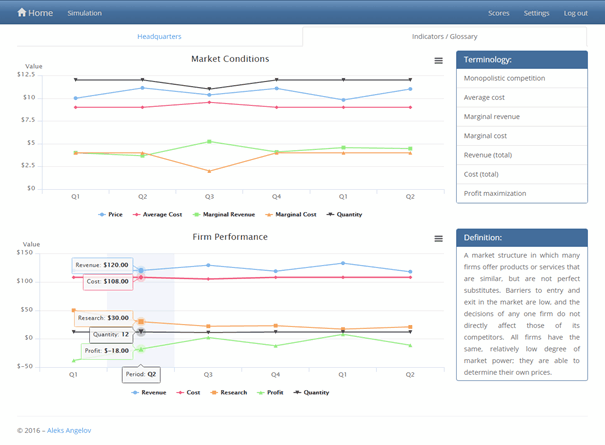
Every quarter, they must take decisions about the quantity of goods the firm produces and the amount it invests in product research. Altering the quantity produced affects both the total revenue generated by the company and the total cost incurred by it. Investing in research has a 50% chance of lowering the firm’s production costs or raising the quality of its product, by an amount proportional to that invested. Each quarter, market conditions dynamically evolve in response to the economic profits the company accrued during the previous term, requiring users to adapt their strategy in order to remain competitive.
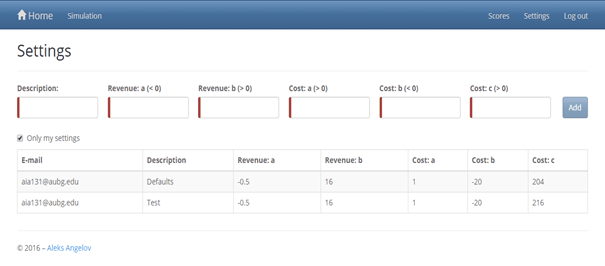
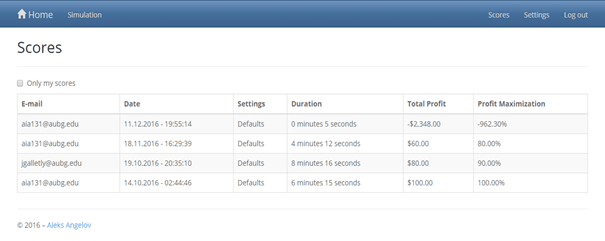
At the end of their mandate as CEO, players are presented with a scoreboard which assesses their performance and enables them to compare their results with those of others. In addition, users are able to customize their experience by setting the parameters of the economic model behind the simulation, allowing them to choose their own level of difficulty and to emulate various market states.
3. Implementation
Perhaps the most interesting aspect of the simulator is the adaptation of the theoretical economic model of monopolistic competition to a strictly defined algorithm, which can be readily translated into code. As I could not find any relevant publicly available work on the Internet, I have devised such an algorithm myself, based on my own knowledge, and on the explanations and mathematical models found in economics textbooks and in other materials, which I have used throughout my undergraduate studies.
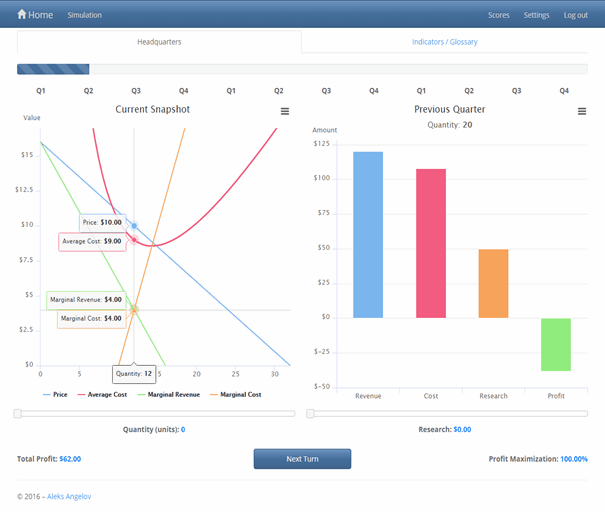
The initial steps consisted of compiling a list of the essential variables which appear in the theoretical model and then describing the relations between them with mathematical equations. I identified six variables and classified them into two categories – Revenue and Cost. The Revenue variables are price (P), which for the purposes of the model is equivalent to average revenue and to demand, total revenue (TR), and marginal revenue (MR). The Cost ones are total cost (TC), average cost (AC), and marginal cost (MC). To formulate the relations between these variables, I took advantage of the fact that all of them can be represented as functions of the quantity produced/sold (Q) or as first derivatives of such functions, yielding:
- P = a*Q + b
- TR = P * Q = (a*Q + b) * Q = a*Q^2 + b*Q
- MR = dTR/dQ = 2*a*Q + b
for the Revenue category (where a and b are parameters, with a < 0 and b > 0) and:
- TC = a*Q2 + b*Q + c
- AC = TC / Q = a*Q + b + c/Q
- MC = dTC/dQ = 2*a*Q + b
for the Cost category (where a, b, and c are parameters, with a > 0, b < 0, and c > 0).
Profit is defined as the difference between total revenue and total cost. It can be mathematically proven that for each pair of total revenue and total cost functions, there is a certain quantity which maximizes this difference. In the case of monopolistic competition, this profit-maximizing quantity is identical to the quantity which leads to equal marginal revenue and marginal cost, as well as to the quantity which results in the greatest difference between price and average cost. Thus, the level of profit maximization for a given quantity can be numerically expressed as the ratio of profit earned by producing and selling it to the profit that could have been accrued by producing and selling the profit-maximizing quantity. Furthermore, according to the theory of monopolistic competition, if a firm earns positive profit, new competitors enter its market, decreasing the demand for the firm’s product.
With this implementation of the theoretical model, formulating an algorithm for a single turn of the economic simulation becomes straightforward:
- The user provides an amount for the quantity produced/sold.
- The simulator estimates the values of the six Revenue and Cost variables using the respective functions.
- The simulator calculates the corresponding amount of profit by subtracting total cost from total revenue.
- The simulator evaluates the profit-maximizing quantity by exploiting its above-mentioned properties.
- Based on the level of profit the user accrues, the simulator adjusts the parameters of the Revenue equations.
In order to make the simulation more interactive and less predictable, I have introduced a pseudo-random element to it. Each turn, the user can decide to invest some of his/her profit in product research. Doing so has a 50% chance of lowering his/her firm’s production costs or of raising the quality of its product, by an amount proportional to that invested.
4. Technology
The determining factor while considering the various options for the form of the project (i.e. whether it should be a desktop, mobile, or web application) has been accessibility. My desire has been to make the simulator available to as many prospective users as possible, regardless of their devices and operating systems. This is the chief reason behind my decision to implement it as a mobile-friendly web application. Having a browser which supports HTML5 is the only prerequisite for running the software. No external plugins are required.
The project has been implemented as a single-page application, featuring the latest web technologies. For data access, I have relied on a SQL Server 2016 relational database and on Microsoft’s new ASP.NET Core Web API. For the business logic and the user interface, I have employed Google’s Angular 2 framework. Supplementary technologies include Bootstrap, Highcharts, and jQuery (with jQuery UI). Consequently, T-SQL, C#, TypeScript, HTML, and CSS, comprise the codebase of the application. Finally, Visual Studio 2015 and SQL Server Management Studio have provided the tools needed to put everything together.
5. Screenshots
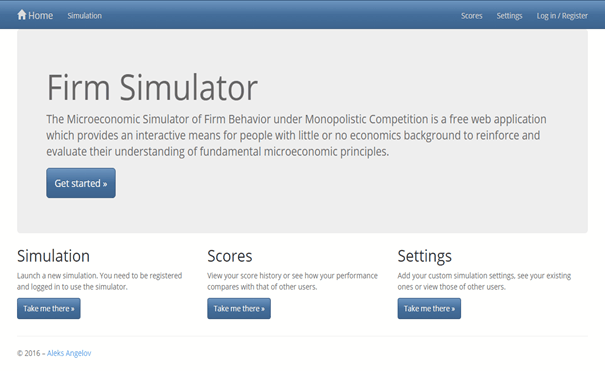
A. Landing Page
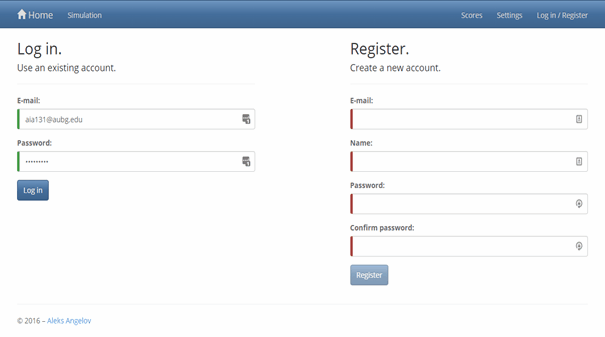
B. User Authentication
C. Simulator Introduction
D. Settings Page
E. Headquarters Tab
F. Indicators/Glossary Tab
G. Scoreboard Dialog
H. Scores Page
6. Final Result
The software is accessible at https://firmsimulator.azurewebsites.net until December 2017.
References
[1] Investopedia. (2016). Monopolistic Competition [Online]. Available: http://www.investopedia.com/terms/m/monopolisticmarket.asp
[2] Chang Jung Christian University. (2016). Monopolistic Competition and Oligopoly [Online]. Available: http://web.cjcu.edu.tw/~lcc/Courses/sg13.pdf
[3] T. J. Webster. (2003). Market Structure: Monopolistic Competition [Online]. Available: http://booksite.elsevier.com/9780127408521/exercises/131to144.pdf
↑ Top