A Simulator for Teaching Macroeconomics at Undergraduate Level
Note: there is a download link for the software itself below.
Abstract
The integration of technology in the educational process is becoming increasingly important for improving the 21st century student’s understanding and retention of academic material. Being able to readily apply the theory covered in class and to automatically receive immediate feedback is invaluable. And with gamification now permeating into nearly every area of our lives, computer games are proving to be an effective way to successfully engage any audience.
Presently, there are only a few freely available macroeconomic simulators on the Internet which are suitable for undergraduate students. The two most prominent ones are the European Central Bank’s €conomia and the Chair the Fed game. But both of them focus solely on monetary policy. Thus, there is no educational simulator that allows students to examine the effects of fiscal policy. This is particularly problematic since Bulgaria and several other countries in the region, which are not part of the Eurozone, operate under a currency board, meaning that they do not have much control over their monetary policy, so the emphasis there is mainly on conducting fiscal policy. Hence, Prof. Vasilev and I developed the “Keynesian Macroeconomic Simulator of Fiscal Policy”.
Keywords: fiscal policy, simulators, macroeconomic principles, teaching innovations, AS-AD framework
1. Introduction
The purpose of the “Keynesian Macroeconomic Simulator of Fiscal Policy” is to facilitate teaching basic macroeconomic principles to undergraduate students by providing them with a hands-on opportunity to experiment with the various macroeconomic variables they study in class and to observe their effects on a country’s economy.
The computer simulator is based on the aggregate demand – aggregate supply (AD-AS) macroeconomic model, which is covered in the Principles of Macroeconomics course at the American University in Bulgaria. The reason for choosing the AD-AS model for the simulator is that, apart from it being the first macroeconomic model students are introduced to, having a solid understanding of this fundamental model is crucial for comprehending more complex models, such as the IS-LM model from Intermediate Macroeconomics and the Real-Business-Cycle/New-Keynesian models from advanced courses.
2. Design
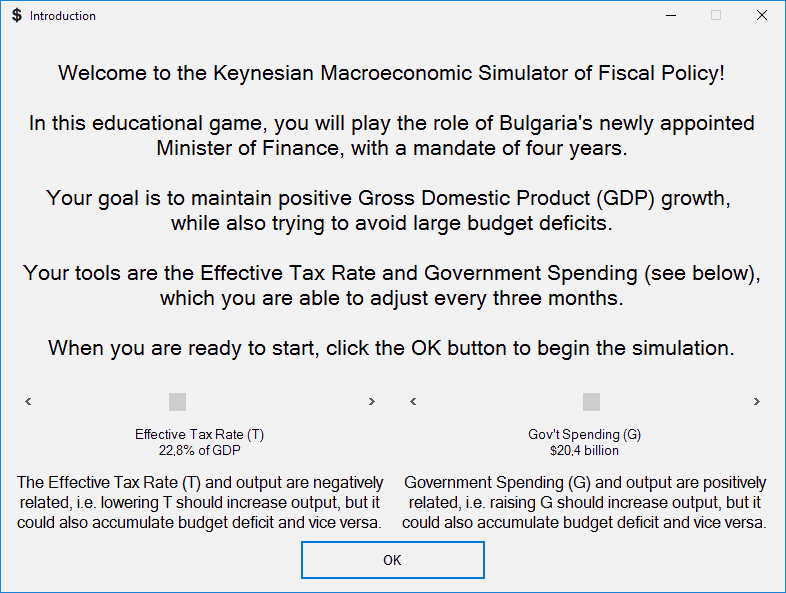
Similar to how ECB’s €conomia [1] and Chair the Fed [2] give players control over the respective main interest rate, in this simulator, students are in charge of the effective tax rate (T) and of government spending (G) – the two major instruments which governments use to conduct fiscal policy.
Students have a mandate of four years (sixteen quarters) as the finance minister of Bulgaria. Each quarter, they are be able to set target values for T and G. The primary objective of the game is to maintain a positive, stable Gross Domestic Product (GDP) growth, while also trying to avoid large, chronic budget deficits. After setting target values for G and T for the sixteenth quarter, students are presented with a scoreboard, which measures how successfully they have accomplished the above two objectives.
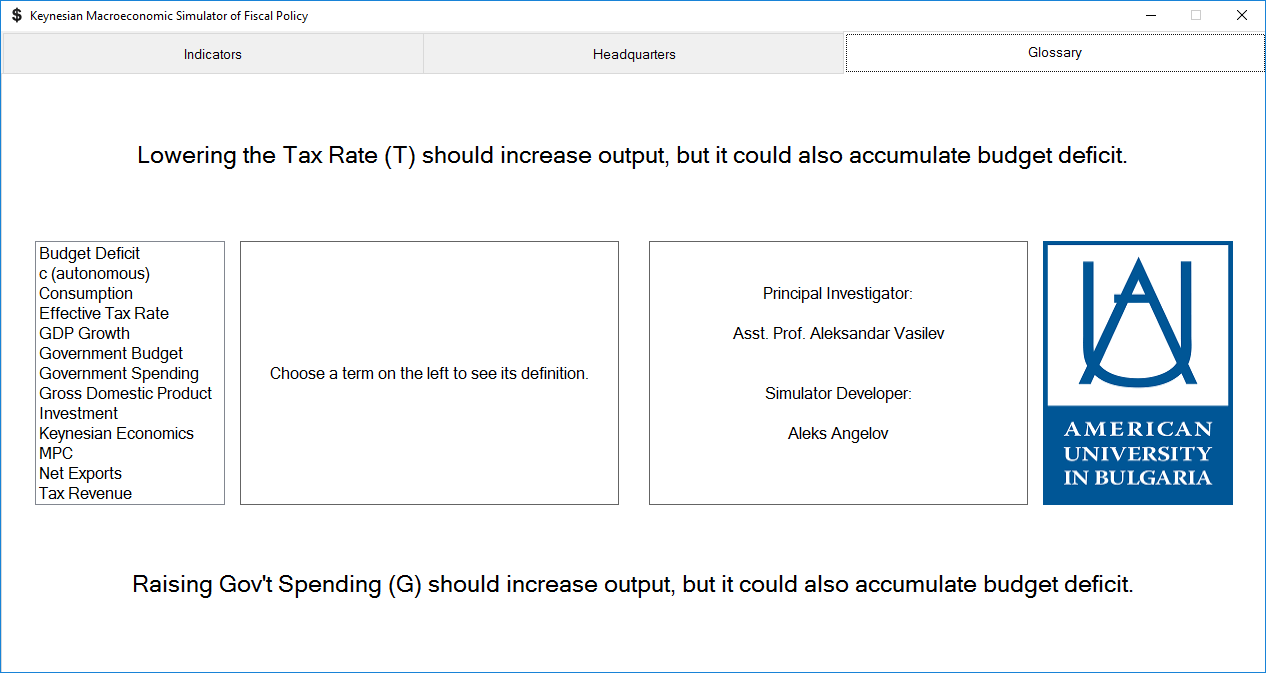
The initial state and economic equations of the simulator reflect the latest available macroeconomic data for Bulgaria [3, 4]. For additional realism, the game includes a random event generator, which produces various negative shocks that students need to address. The simulator also features a brief introductory tutorial and an economic terms glossary. The target audience are undergraduate students with little or no economics background.
3. Implementation
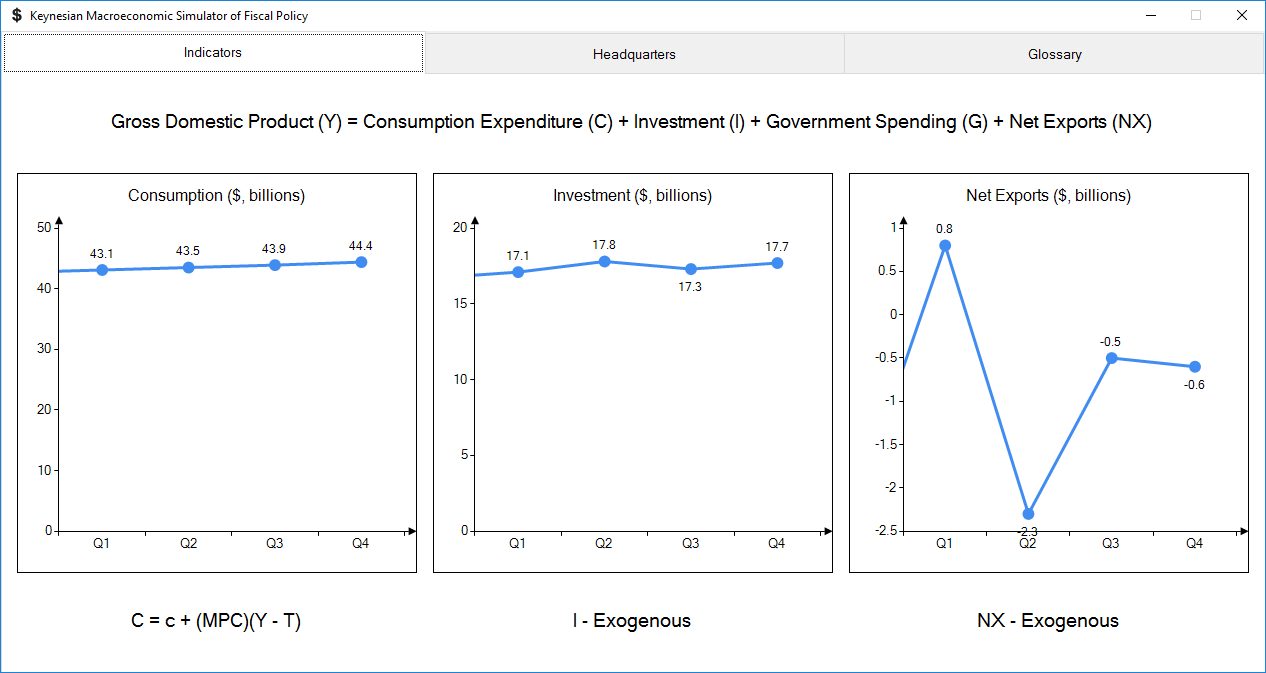
The simulator incorporates the expenditure approach to measuring GDP because it is the most convenient for demonstrating the effect of government spending and taxes on economic growth.
GDP (Y) = Consumption (C) + Investment (I) + Government Spending (G) + Net Exports (NX)
where, according to Keynesian theory:
- C = Autonomous cons. (c) + Marginal Propensity to Consume (MPC) ∗ Net Income (Y−T)
- I and NX=Exports (X)−Imports (M) are exogenous.
All given initial values in the simulator are either taken or derived from 2014 data for Bulgaria [3].
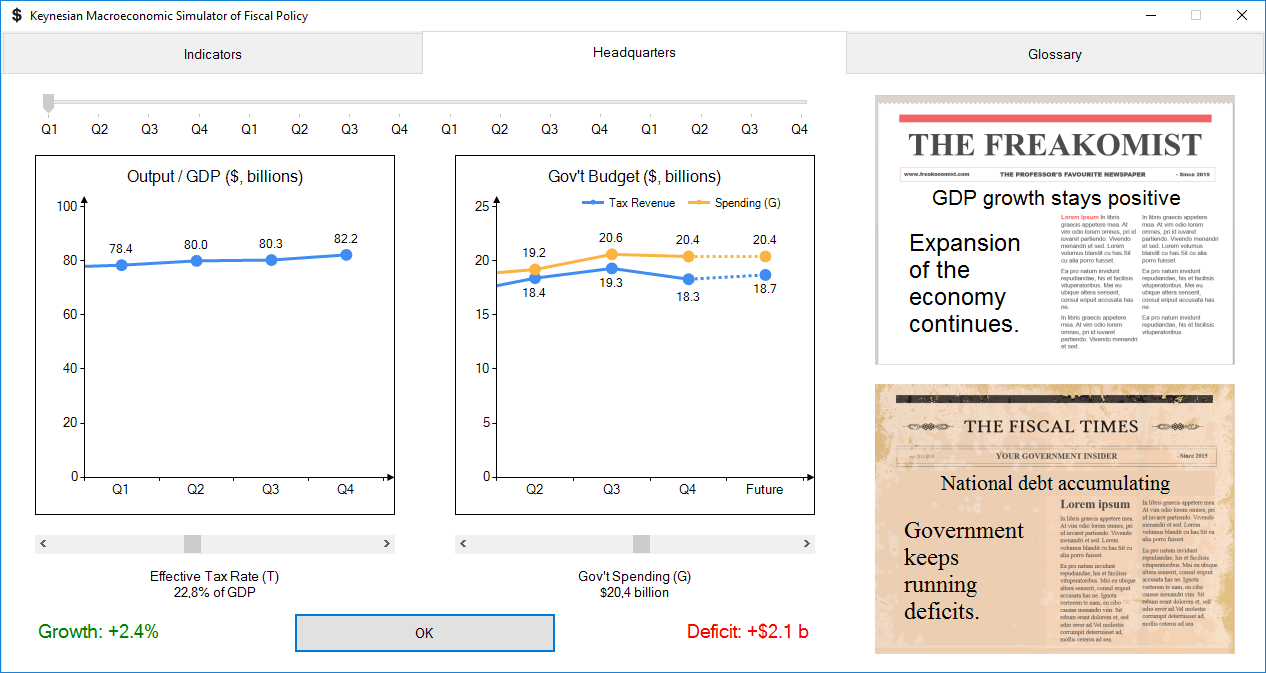
Every quarter, when the student sets desired target values of G and T for the upcoming quarter, the simulator produces the next snapshot of the economy by completing the following sequence:
- If the current quarter was selected to feature a negative shock event, the effects of the shock are incorporated into the respective equations and graphs. In addition, the newspapers displayed on the main screen alarm the student about the shock. There are three types of shocks, which appear in random quarters and in a random order – a drop in MPC, a decline in I, and a fall of X.
- The remaining components of GDP (C, I, and NX) are reevaluated through partial derivative equations with respect to the new values of G and T. All corresponding graphs are then updated.
- The new value of GDP is estimated using the sum of the partial differentials of its components.
- The GDP growth percent and budget deficit/surplus are calculated and shown at the bottom.
- The two newspaper headlines verbally reflect the fluctuations in GDP and the budget balance.
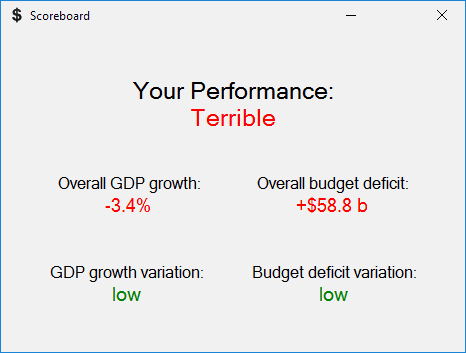
After the student has set target values for G and T in the sixteenth quarter, the simulator generates an assessment scoreboard of the student’s performance, based on these four criteria:
- Overall GDP growth – the total growth of GDP as compared to its initial value – up to 4 points.
- Overall budget deficit – the sum of budget deficits/surpluses for all 16 quarters – up to 2 points.
- GDP growth variation – an estimate of the standard deviation of GDP growth – up to 1 point.
- Budget deficit variation - an estimate of the std. dev. of the budget balance – up to 0.5 points.
The total number of points determines the grade of the student: Excellent, Mediocre, or Terrible.
4. Technology
After considering the hardware and software which is available inside the classrooms of our university, we decided to develop the simulator with Microsoft’s C# programming language and .NET framework. This ensures compatibility with Windows operating systems and provides a native look and feel.
The simulator is based on Windows Forms, as it offers built-in data visualization controls. It is deployed as a portable executable file in order to facilitate distribution.
5. Screenshots
Introductory tutorial
Main screen
Component graphs
Glossary
Scoreboard
6. Download
The software is freeware for Windows. Download simulator.zip (1.21 MB), unzip it and run Simulator.exe
References
[1] European Central Bank. (2011, May 4). €conomia game. Retrieved from https://www.ecb.europa.eu/ecb/educational/economia/html/index.en.html
[2] The Federal Reserve Bank of San Francisco. (2015, April 30). Chair the Fed. Retrieved from http://sffed-education.org/chairthefed/default.html
[3] National Statistical Institute. (2014, October 10). GDP by Final Expenditure. Retrieved from http://www.nsi.bg/en/content/5490/gdp-final-expenditure-%E2%80%93-total-economy
[4] Ministry of Finance. (2014, December 24). Budget 2015. Retrieved from http://www.minfin.bg/bg/page/940 (no English version)
↑ Top