
From statistical methods to data-analysis skills: redesigning first-year economics statistics
Background
When teaching statistics to first-year economics students, I have often found that the challenge is helping them understand why statistical methods matter beyond the classroom. At the University of Leicester, I have addressed this by introducing more relevant datasets and, more recently, redesigning assessment to place greater emphasis on practical data-analysis skills.
My approach developed across two first-year modules: Statistical Inference, which I taught from 2018/19 to 2021/22, and Statistics for Economists II, which I began teaching in 2022 and redesigned as Introduction to Economic Data Analysis in 2024/25.
These experiences raised a question that became increasingly important to me: how could I assess not only whether students arrived at the correct answers, but also how they worked with data to reach them?
Starting with familiar questions: Statistical Inference
Statistical Inference was assessed through 20% individual coursework and an 80% examination, with no dedicated computer classes. Although the coursework already involved applied questions, I wanted to make the examples more relevant to students' lives and wider social issues.
In 2018/19, I introduced coursework using UK gender pay gap data. Students estimated the average pay gap, conducted a hypothesis test and interpreted their findings. Besides making the exercise more relevant, I hoped to encourage reflection on workplace inequality and inclusion. In 2021/22, I used food hygiene ratings for 100 Leicester businesses. Students tested whether the average rating exceeded four and constructed a confidence interval. Both exercises retained the statistical methods while giving students more meaningful contexts in which to interpret their results.
Moving to UK household data: Statistics for Economists II
When I began teaching Statistics for Economists II in 2022, the module was assessed through 30% individual coursework and a 70% examination. I retained these weights but replaced the coursework's US Healthy Eating Index dataset with the 2022 Bank of England household survey. Students used Excel to produce tables and charts, build pivot tables, calculate confidence intervals and carry out hypothesis tests.
Unlike Statistical Inference, this module also had computer classes where students could practise using Excel. However, the classes went straight into statistical analysis, assuming that students were already familiar with Excel's basic functions. I felt that students needed more time to learn the basics of Excel before using it for statistical analysis, and this became one of the priorities for the later redesign.
At this stage, the statistical methods and assessment structure remained largely unchanged. My main focus was on making the coursework more relevant to students by using data about UK households rather than a textbook dataset from another country. Some student comments were encouraging. In 2022/23, one respondent appreciated learning statistics alongside “its application in Excel”. In 2023/24, another said that real-world examples gave them “a more practical understanding of stats”.
Changing the teaching and assessment: Introduction to Economic Data Analysis
In 2024/25, I made a larger change to EC1009 and renamed it Introduction to Economic Data Analysis. I wanted the module to go beyond teaching statistical methods and help students understand how to approach a data-analysis project from the beginning. Previously, the module started directly with basic statistics, with little attention given to where data comes from, how it should be prepared or how to explore it before applying statistical methods.
To address this, I introduced two new topics, Basics of Data and Data Exploration, at the beginning of the module. These cover the early stages of a data-analysis project, from collecting and cleaning data to exploring patterns and deciding how best to present the information using tables and charts. I wanted students to understand that data analysis does not begin with choosing a statistical test. It begins with understanding the data, checking its quality and identifying what questions it might help answer.
I also made changes to the computer classes. Previously, students had moved straight into statistical analysis using Excel, often without being familiar with its basic functions. I introduced two sessions on Excel essentials before moving on to statistical applications. Together, these changes were intended to give students a clearer understanding of the data-analysis process and the practical skills needed to carry it out.
Alongside these changes to teaching, I redesigned the assessment. The previous examination, worth 70% of the module, already used applied statistical questions, but students typically worked with small, prepared datasets or summary statistics and carried out specified calculations. I replaced it with a 70% group data-analysis project, while the remaining 30% became an individual Blackboard test using real datasets. The project requires students to work with a larger household dataset, clean and explore the data, select appropriate statistical methods and communicate their findings. This was intended to assess a broader range of practical analytical skills than a timed examination could readily capture.
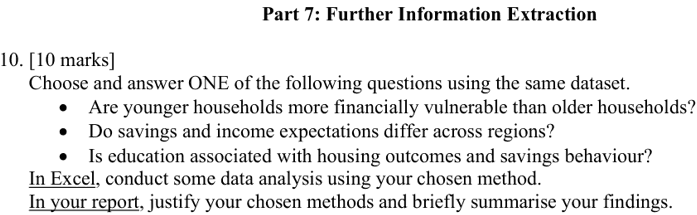
Burnett (2020) describes an approach to self-guided data exploration in Excel. Although my project provides students with more structured tasks, I similarly wanted them to engage directly with data rather than simply reproduce statistical procedures. For the 2025/26 project, students worked in groups of three or four with the 2024 NMG household survey, conducted on behalf of the Bank of England. They handled missing values, produced descriptive statistics and charts, and applied methods including confidence intervals, hypothesis tests, ANOVA and goodness-of-fit tests. Towards the end of the project, students chose one research question from a short list, such as whether younger households were more financially vulnerable than older households (Figure 1). This gave them some choice over what to investigate while requiring them to select appropriate methods, justify their decisions and interpret their findings. The intention was to move beyond following a prescribed set of calculations towards making more independent analytical decisions.
Figure 1. Extract from the 2025/26 group project showing the choice of research question and the requirement to explain the analysis
Checking how students reached their answers
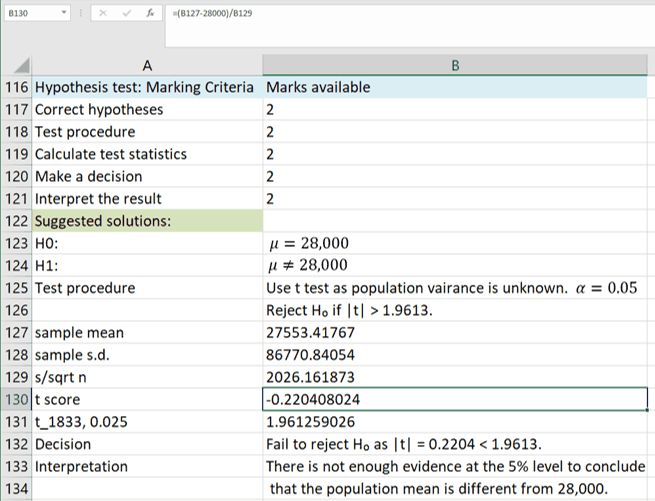
To assess the analytical process rather than only the final findings, students submit both a written report and an Excel workbook, with half the marks for each question allocated to each component. Markers inspect formulas, cell references and the data behind charts to check how students arrived at their answers. This connects assessment with the skills developed in lectures and computer classes (Biggs, 1996), while making the project more representative of workplace data-analysis tasks (Gulikers et al., 2004). However, inspecting the workbook cannot establish who completed the work or whether AI was used.
Figure 2. Extract from the Excel marking guidance showing five stages of hypothesis testing, each worth two marks, and the t-statistic calculation in the formula bar
Fairness is also an issue with group assessment: group members normally receive the same project mark even if they contribute different amounts. The separate 30% Blackboard test provides an individual assessment of students' understanding, although it cannot fully address differences in contributions to the group project. Students are encouraged to raise participation problems within their group first. Where needed, a formal non-participation procedure can lead to separate marks based on evidence of contribution, and an individual alternative with fewer tasks is available when group work is not possible.
Teaching and student responses
In lectures, I introduce the statistical ideas and use worked examples and Top Hat questions to check understanding. Computer classes give students time to practise in Excel, starting with basic skills because their previous experience varies considerably. The University's work-related learning team also submitted the module's activities and transferable skills for review by a senior economist at the Bank of England. Following this review, the module received approval for recognition of 40 hours of work-related learning. This was a formal allocation rather than a measurement of the time individual students spent on the activities.
Student feedback has been mixed, and the number of responses has been small relative to the size of the module, which enrolled between 344 and 384 students during this period. In the 2024/25 mid-module survey (22 responses), one student said that real-life scenarios made the material easier to understand. In the 2025/26 end-of-module evaluation (four responses), students commented positively on the interactive lectures and computer classes, although some felt that the Excel classes moved too quickly or that the instructions were difficult to follow. These voluntary comments tell me something about students' experiences, but they do not show whether their analytical skills improved. Comparing module marks before and after the redesign would not settle that question either, because the assessment changed so substantially.
Looking ahead, I would like to give students more opportunities to practise Excel independently, supported by clearer instructions and short demonstrations they can revisit. I also plan to invite guest speakers from industry and other organisations to share how they use data analysis in their work, the types of problems they encounter and the skills they find most useful. I hope this will help students see how what they learn in the classroom connects to real jobs and career opportunities.
My experience has taught me that familiar datasets can make statistics more engaging, but relevance alone is not enough. Students also need opportunities to work through the different stages of data analysis, make decisions about their methods and explain what their findings mean. This is what I hope the redesigned module will help them achieve.
References
Biggs, J. (1996). Enhancing teaching through constructive alignment. Higher Education, 32(3), 347–364. https://doi.org/10.1007/BF00138871
Burnett, T. (2020). Using self-guided data exploration in Excel. Economics Network Ideas Bank (Virtual Symposium on Online Teaching). https://doi.org/10.53593/n3311a
Gulikers, J. T. M., Bastiaens, T. J. and Kirschner, P. A. (2004). A five-dimensional framework for authentic assessment. Educational Technology Research and Development, 52(3), 67–86. https://doi.org/10.1007/BF02504676
↑ Top