Interactive Graphs for Statistics for Social Science
Martin Poulter, DeSTRESS Project
These graphs redraw themselves dynamically in response to user clicks (or touches, if you're using a tablet device). They are web pages with embedded programs, requiring no plug-ins or special software. They may be quite slow in some versions of Internet Explorer.
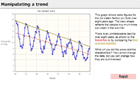 1. Effect on trendlines of censoring data
regression line; effect of choosing starting point
Download as a content package for your virtual learning environment
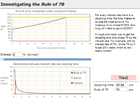 2. Evaluating the Rule of 70
exponential growth; percentage error
Download as a content package
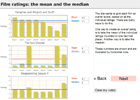 3. Mean versus median: film ratings
robustness of median relative to the mean
Download as a content package
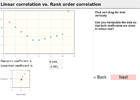 4. Pearson versus Spearman correlations
types of correlation; similarities and differences
Download as a content package
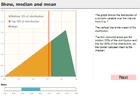 5. Skew, mean and median
mode, mean, median of continuous (triangular) distribution
Download as a content package
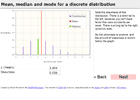 6. Skew in a discrete distribution (counterpoint to above)
mode, mean, median of discrete (Poisson) distribution
Download as a content package
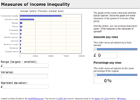 7. Measures of income spread
absolute and percentage change; range, s.d. and variance
Download as a content package
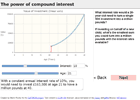 8. The power of compound interest
logarithmic axis
Download as a content package
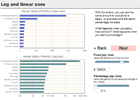 9. Logarithmic axes and income
measures of spread; absolute change versus percentage change
Download as a content package
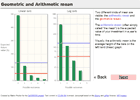 10. Arithmetic versus geometric mean
probability; expected return; geometric mean as long-term expected return
Download as a content package
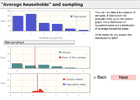 11. The shape of the sampling distribution
sampling from a skewed distribution; distinguishing the population, sample and sampling distribution
12. Distribution of sample standard deviations and why we use n-1 to calculate sample sd (incomplete)
sampling; Bessel's correction
13. Correlation of a sample (incomplete)
Licences: Creative Commons Attribution-ShareAlike (text content); MIT licence (Javascript code).
University of Sussex
Interactive Excel spreadsheets

Except where stated, DeSTRESS resources are available under a Creative Commons Attribution-Noncommerical-ShareAlike licence which guarantees your right to remix and reuse.
Logos remain the property of their respective institutions and organisations, all rights reserved. Takedown policy
DeSTRESS was funded by the Higher Education Academy/ JISC Open Educational Resource programme.